Open Access | Research
This work is licensed under a Creative Commons Attribution-ShareAlike 4.0 International License.
Approximate prediction of life expectancy in the older people using a revised equation for estimating somatic telomere length from clinical blood data
* Corresponding author: Toyoki Maeda
Mailing address: Kyushu University Beppu Hospital 4546 Tsurumihara, Beppu, Oita, Social Medical Corporation San-aikai
Geriatric health services facility Tabaru, Hukada 936-1-1, Tabaru,
Oita 870-1154, Japan.
Email: maedat_0717@yahoo.co.jp
Received: 28 April 2026 / Revised: 26 May 2026 / Accepted: 22 June 2026 / Published: 30 June 2026
DOI: 10.31491/APT.2026.06.219
Abstract
We previously proposed an equation for estimating somatic telomere length (TL) from peripheral blood test values. Here, we reexamined data from a larger number of individuals and found that the hemoglobin levels in men and serum albumin levels in women were well correlated with the measured TL values. We developed a new simplified estimated TL (eTL) equation that incorporates these test values. We analyzed the relationship between eTL derived from this revised equation based on the test values from a single day and life expectancy until death among residents of elderly care facilities, thereby exploring the correlation between eTL and life expectancy. The results revealed that the eTL values exhibited a significant negative correlation with the number of days until death due to senility. This data suggests that the eTL values can also be used as a tool for assessing the progression of senility in the very elderly. Furthermore, this correlation was no longer significant in populations in which the eTL values exceeded the TL values predicted by age-based regression. Therefore, this discrepancy between eTL and life expectancy may be more pronounced in old individuals who do not live in nursing homes. Furthermore, among elderly residents of nursing homes, serum albumin levels and serum cholesterol levels in men with shorter eTLs were positively correlated with eTLs in both men and women. The relationship between TL maintenance and nutritional status in the elderly is a topic that should be investigated further.
Keywords
Aging, life expectancy, telomere, clinical laboratory data, elderly, geriatric health services facility
Introduction
As we age, our bodies undergo progressive changes that ultimately lead to death. Human aging manifests according to the changes in the body’s biological characteristics. Progressive shortening of telomeric DNA is among the indicators of aging-related changes in somatic
cells [1, 2]. Telomere shortening is accelerated by various pathological conditions and shortened telomeres induce
pathological conditions [1]. Considering that the pathological conditions are often reflected in the patients’ blood test results, somatic telomere length (TL) may be associated with multiple laboratory test
parameters [3–12]. Therefore, I investigated the correlations between various laboratory test parameters and peripheral blood leukocyte TL and developed an equation for estimating peripheral
blood leukocyte TL by combining multiple correlated laboratory test parameters [13]. This initial eTL showed a tendency to shorten in relation to factors associated with aging progression, such as worsening care needs, decreased number
of remaining teeth, history of cancer, and history of ischemic heart disease among residents of a geriatric health service facility [14]. In this study, we increased the number of study participants and formulated a new TL estimation equation
to develop a simpler TL estimation approach. This estimated telomere length (eTL) calculation involves only age and clinical test values, without requiring genomic DNA extraction. Therefore, observational studies using this approach will not require the
timeconsuming ethical review that are warranted for telomere DNA or genome analysis. Furthermore, considering the circumstances wherein genomic DNA extraction is not possible, current TL can be estimated using past test data alone. This approach has the potential to facilitate more extensive
research on physiological and pathological changes associated with aging, as well as telomere shortening, a key genomic aging indicator [14].
The elderly care facility in which the present study was conducted is not a hospital, and residents with serious health problems are admitted to a nearby hospital. Therefore, deaths within the facility are limited to those who would succumb to senility that cannot be treated in a hospital.
I proposed employing eTL as a biomarker for evaluating the aging status of residents in this elderly care facility, with particular emphasis on the eTL progressive change that led to death in residents due to senility within the facility. By observing the process of natural death of these residents, I can monitor the progression of aging that leads to natural death, rather than death resulting from illness, as is the case with hospitalized patients. Although clinical research on various diseases is possible at university hospitals, it is difficult to observe the natural progression leading to death from senility. However, such observation is possible at elderly care facilities. Accordingly, I hypothesized that eTL may serve as a biomarker for evaluating the progression of aging in elderly care facility residents.
Given that TL is inversely correlated with aging, TL should shorten as life expectancy decreases or death approaches. Therefore, by tracking eTL retroactively from the date of death, it is possible to observe the TL shortening as natural death approaches. Therefore, in the present study, I aimed to examine whether eTL, calculated from the routine test results of elderly care facility residents, is correlated with the time interval from the date of
testing to death due to senility.
Methods
The present study included 340 participants including patients who visited the Department of Internal Medicine at Kyushu University Beppu Hospital between 2012 and 2016, and hospital staff, who agreed to participate in this research. The study cohort comprised 196 men (67.8 ± 13.3 years) and 144 women (72.7 ± 14.4 years), all of whom provided informed consent by signing a form approved by the Conjoint Health Research Ethics Board of Kyushu University (Approval number 203). I excluded patients with acute infections and cancer patients undergoing anticancer drug treatment. However, patients taking analgesics, antihypertensives, hypnotics, antidiabetics, antihyperlipidemics, and anticoagulants were included in the analyses. This suggests that the revised eTL values can also be applied to populations taking medications commonly used in the elderly. Apart from the individuals initially analyzed to establish the revised eTL, I analyzed elderly deaths among 663 residents (275 men and 388 women) who entered the geriatric health services facility Tabaru between August 1, 2020, and July 31, 2025. At this facility, blood tests are conducted after obtaining comprehensive consent for the use of personal information for medical research purposes. Informed consent was also obtained from the individuals or their families at the time of admission. The patients were categorized into a survival group, consisting of those who did not die during their stay (391 residents; 145 men and 246 women) and a death group, comprising those who died of senility (272 residents, 130 men and 142 women). The data of the two groups were analyzed and compared. The mean age at death was 90.3 ± 7.5 years for all residents, 87.3 ± 7.5 years for men, and 92.6 years ± 6.9 years for women. These deaths were diagnosed as deaths due to senility after the facility's full-time physician, who was present at the time of the resident's death, confirmed that no other causes of death were found. The mean ages of the survival group at the time of blood test were 87.0 ± 8.0 years and 82.9 ± 9.7 years for men and women, respectively. The mean ages of the death group at the time of blood test were 85.6 ± 7.3 years and 91.8 ± 6.5 years for men and women, respectively.
Laboratory data
Biochemical and hematological analysis of blood samples was performed by Bio Majesty JCA-BM1650 (JEOL Ltd., Tokyo, Japan) and Sysmex XE-2100 (Sysmex Corporation, Kobe, Japan) at the laboratory of Kyushu University Beppu Hospital for the construction of the eTL estimation equation. The analysis of blood samples collected from the geriatric health services facility Tabaru was outsourced to RINTEK Co., Ltd. Oita branch.
TL measurement
TL was measured according to a previously reported method [13]. Briefly, peripheral blood samples were collected, genomic DNA was extracted from leukocytes, and telomere fragments containing telomere sequences were analyzed through a Southern blot analysis using a tetranucleotide-recognizing restriction enzyme (MspI). The mean leukocyte TL was calculated by integrating and averaging the density distribution obtained by densitometry of the smear images of the sections. All samples were measured in triplicate, and the resulting mean values were used for the subsequent analysis.
Statistical analysis
Using linear regression analysis, I explored optimal candidate test items for inclusion in the eTL estimation formula [13] (Table 1). Furthermore, in formulating an equation that includes these optimal test items, we used linear regression analysis and polynomial regression analysis to construct a simple equation that estimates the eTL closest to the measured TL (Table 2).
Table 1.
Correlations of blood test data with telomere length (MspI TL).
| Men | Women | |||
|---|---|---|---|---|
| β (95% CI) | P-value | β (95% CI) | P-value | |
| AST (U/L) | -0.949 (-3.823–1.926) | 0.516 | -2.139 (-4.639–0.361) | 0.093 |
| ALT (U/L) | -0.775 (-4.286–2.735) | 0.664 | 1.112 (-1.135–3.359) | 0.330 |
| BUN (mg/dL) | -1.338 (-2.796–0.121) | 0.072 | -2.556 (-3.865–1.248) | < 0.001*** |
| Crnn (mg/dL) | -0.066 (-0.153–0.022) | 0.140 | -0.059 (-0.130–0.012) | 0.101 |
| T-Chol (mg/dL) | 3.706 (-2.586–9.999) | 0.247 | 2.591 (-4.382–9.565) | 0.464 |
| LDL (mg/dL) | 6.104 (-0.375–12.583) | 0.065 | 0.624 (-6.831–8.080) | 0.869 |
| HDL (mg/dL) | -1.505 (-4.671–1.661) | 0.349 | 1.902 (-2.211–6.016) | 0.362 |
| TG (mg/dL) | 5.751 (-8.722–20.223) | 0.433 | -4.524 (-17.991–8.944) | 0.507 |
| Na (mEq/L) | -0.224 (-0.702–0.254) | 0.357 | 1.120 (0.434–1.805) | 0.002** |
| K (mEq/L) | 0.015 (-0.058–0.088) | 0.678 | -0.014 (-0.109–0.080) | 0.766 |
| Cl (mEq/L) | -0.526 (-1.268–0.215) | 0.163 | 1.604 (0.687–2.521) | 0.001** |
| Albumin (g/dL) | 0.064 (-0.037–0.165) | 0.214 | 0.237 (0.148–0.327) | < 0.001*** |
| TP (g/dL) | 0.018 (-0.123–0.159) | 0.802 | 0.102 (-0.039–0.244) | 0.153 |
| Glo (g/dL) | -0.062 (-0.162–0.038) | 0.222 | -0.154 (-0.317–0.010) | 0.066 |
| WBC(/mm3) | -9.905 (-339.444–319.635) | 0.953 | -18.856 (-332.506–294.793) | 0.906 |
| RBC (× 104/mm3) | 17.517 (5.996–29.038) | 0.003** | 17.363 (9.247–25.479) | < 0.001*** |
| Hb (g/dL) | 0.554 (0.204–0.905) | 0.002** | 0.389 (0.135–0.644) | 0.003** |
| Ht (%) | 1.709 (0.458–2.960) | 0.008** | 1.526 (0.606–2.447) | 0.001** |
| plt (x104/mm3) | -0.147 (-1.120–0.825) | 0.765 | 0.676 (-0.387–1.740) | 0.211 |
Note: β, regression coefficient; CI, confidence interval; ETL, estimated telomere length; AST, aspartate transaminase; ALT, alanine transaminase; BUN, blood urea nitrogen; Crnn, creatinine; T-Chol, total cholesterol; HDL, high-density lipoprotein cholesterol; LDL, low-density lipoprotein cholesterol; TG, triglyceride; Na, sodium ion; K, potassium ion; Cl, chloride ion, Alb, albumin; TP, total protein; Glo, globulin; WBC, white blood cell; RBC, red blood cell; Hb, hemoglobin; Ht, hematocrit; Plt, platelet. *P < 0.05, **P < 0.01, ***P < 0.001. Underlined significant P-values remain significant after Bonferroni correction.
Table 2.
Correlations of blood test data with longer and shorter eTLs.
| Men | Women | |||||||||||
|---|---|---|---|---|---|---|---|---|---|---|---|---|
| eTL | Longer eTL | Shorter eTL | eTL | Longer eTL | Shorter eTL | |||||||
| β (95% CI) | P-value | β (95% CI) | P-value | β (95% CI) | P-value | β (95% CI) | P-value | β (95% CI) | P-value | β (95% CI) | P-value | |
| AST | -0.009 (-0.027–0.009) | 0.322 | -0.023 (-0.050–0.004) | 0.087 | -0.002 (-0.027–0.023) | 0.878 | -0.005 (-0.0096–0.0007) | 0.025* | -0.006 (-0.012–0.001) | 0.022* | -0.006 (-0.014–0.003) | 0.208 |
| ALT | -0.005 (-0.024–0.014) | 0.623 | -0.011 (-0.044–0.023) | 0.524 | -0.004 (-0.028–0.021) | 0.765 | -0.003 (-0.0067–0.0007) | 0.115 | -0.005 (-0.008–0.002) | 0.004** | 0.002 (-0.006–0.011) | 0.621 |
| Crnn | -0.0001 (-0.0005–0.0004) | 0.702 | 0.0001 (-0.0003–0.0005) | 0.544 | -0.0002 (-0.0009–0.0005) | 0.617 | -0.0001 (-0.0003–0.0001) | 0.321 | -0.0001 (-0.0003–0.0001) | 0.420 | -0.0002 (-0.00068–0.00021) | 0.292 |
| TChol | 0.039 (0.012–0.066) | 0.006** | 0.032 (-0.055–0.118) | 0.453 | 0.041 (0.017–0.067) | 0.001** | 0.007 (-0.011–0.025) | 0.419 | -0.006 (-0.028–0.017) | 0.620 | 0.010 (-0.022–0.043) | 0.525 |
| Na | 0.0004 (-0.0054–0.0063) | 0.884 | 0.0005 (-0.0092–0.0102) | 0.914 | 0.001 (-0.008–0.009) | 0.829 | 0.002 (-0.001–0.005) | 0.214 | 0.002 (-0.002–0.005) | 0.323 | 0.00005 (-0.0058–0.0059) | 0.986 |
| K | -0.0004 (-0.0011–0.0004) | 0.333 | -0.0006 (-0.0016–0.0004) | 0.214 | 0.0001 (-0.0011–0.0012) | 0.888 | -0.0004 (-0.007–0.0001) | 0.009** | -0.0004 (-0.0008–0.000004) | 0.048* | -0.0003 (-0.0008–0.0002) | 0.235 |
| Cl | 0.003 (-0.002–0.009) | 0.229 | 0.0022 (-0.0007–0.0110) | 0.607 | 0.005 (-0.003–0.013) | 0.205 | 0.002 (-0.001–0.005) | 0.242 | 0.002 (-0.002–0.005) | 0.390 | 0.001 (-0.0052–0.0075) | 0.718 |
| Alb | 0.0007 (0.0003–0.0011) | < 0.001*** | 0.0005 (-0.00025–0.00133) | 0.172 | 0.0008 (0.0003–0.0012) | 0.0011** | 0.0005 (0.0003–0.0008) | < 0.001*** | 0.0001 (0.00006–0.00027) | 0.201 | 0.0003 (0.00005–0.00056) | 0.020* |
| WBC | -4.250 (-8.809–0.309) | 0.067 | -7.184 (-14.909–0.542) | 0.067 | -3.379 (-9.109–2.350) | 0.243 | -0.425 (-1.531–0.680) | 0.448 | -0.411 (-1.773–0.952) | 0.550 | 0.337 (-1.790–2.463) | 0.752 |
| RBC | 0.119 (0.037–0.202) | 0.005** | 0.075 (-0.015–0.164) | 0.100 | 0.063 (-0.031–0.156) | 0.183 | -0.002 (-0.029–0.024) | 0.868 | -0.009 (-0.044–0.027) | 0.626 | -0.008 (-0.053–0.037) | 0.720 |
| Hb | 0.0015 (0.0002–0.0028) | 0.021* | 0.0006 (-0.0007–0.0019) | 0.341 | 0.0007 (-0.0003–0.0017) | 0.195 | 0.0001 (-0.0007–0.0008) | 0.856 | 0.0002 (-0.0008–0.0012) | 0.683 | -0.001 (-0.0018–0.0007) | 0.420 |
| Ht | 0.009 (0.001–0.017) |
0.028* | 0.006 (-0.010–0.021) |
0.461 | 0.005 (-0.002–0.012) |
0.174 | 0.0008 (-0.0016–0.0032) |
0.518 | 0.0003 (-0.0029–0.0036) |
0.839 | -0.0004 (-0.0043–0.0035) |
0.834 |
| Plt | -0.013 (-0.025–0.00009) |
0.052 | -0.013 (-0.030–0.004) |
0.130 | -0.011 (-0.030–0.007) |
0.219 | 0.001 (-0.003–0.005) |
0.569 | -0.0001 (-0.006–0.005) |
0.820 | 0.006 (-0.00004–0.0128) |
0.066 |
Note: β, regression coefficient; CI, confidence interval; ETL, estimated telomere length; AST, aspartate transaminase; ALT, alanine transaminase; BUN, blood urea nitrogen; Crnn, creatinine; T-Chol, total cholesterol; HDL, high-density lipoprotein cholesterol; LDL, low-density lipoprotein cholesterol; TG, triglyceride; Na, sodium ion; K, potassium ion; Cl, chloride ion, Alb, albumin; TP, total protein; Glo, globulin; WBC, white blood cell; RBC, red blood cell; Hb, hemoglobin; Ht, hematocrit; Plt, platelet. *P < 0.05, **P < 0.01, ***P < 0.001. Underlined significant P-values remained significant after Bonferroni correction.
Results
Across all study participants, age and measured TL showed an inverse correlation in both men and women (Figure 1A, B). Regarding the correlation between laboratory test parameters and measured TL, the Hb levels showed a high correlation in men, whereas the serum albumin (Alb) levels showed high correlation in women (Table 1). This supported previous reports on the correlation between laboratory test parameters and measured TL. In the present study, I established approximation equations for calculating eTL using linear regression analysis and polynomial regression analysis, employing age and Hb levels in men, and age and serum albumin (Alb) levels in women (Figure 2A, B).
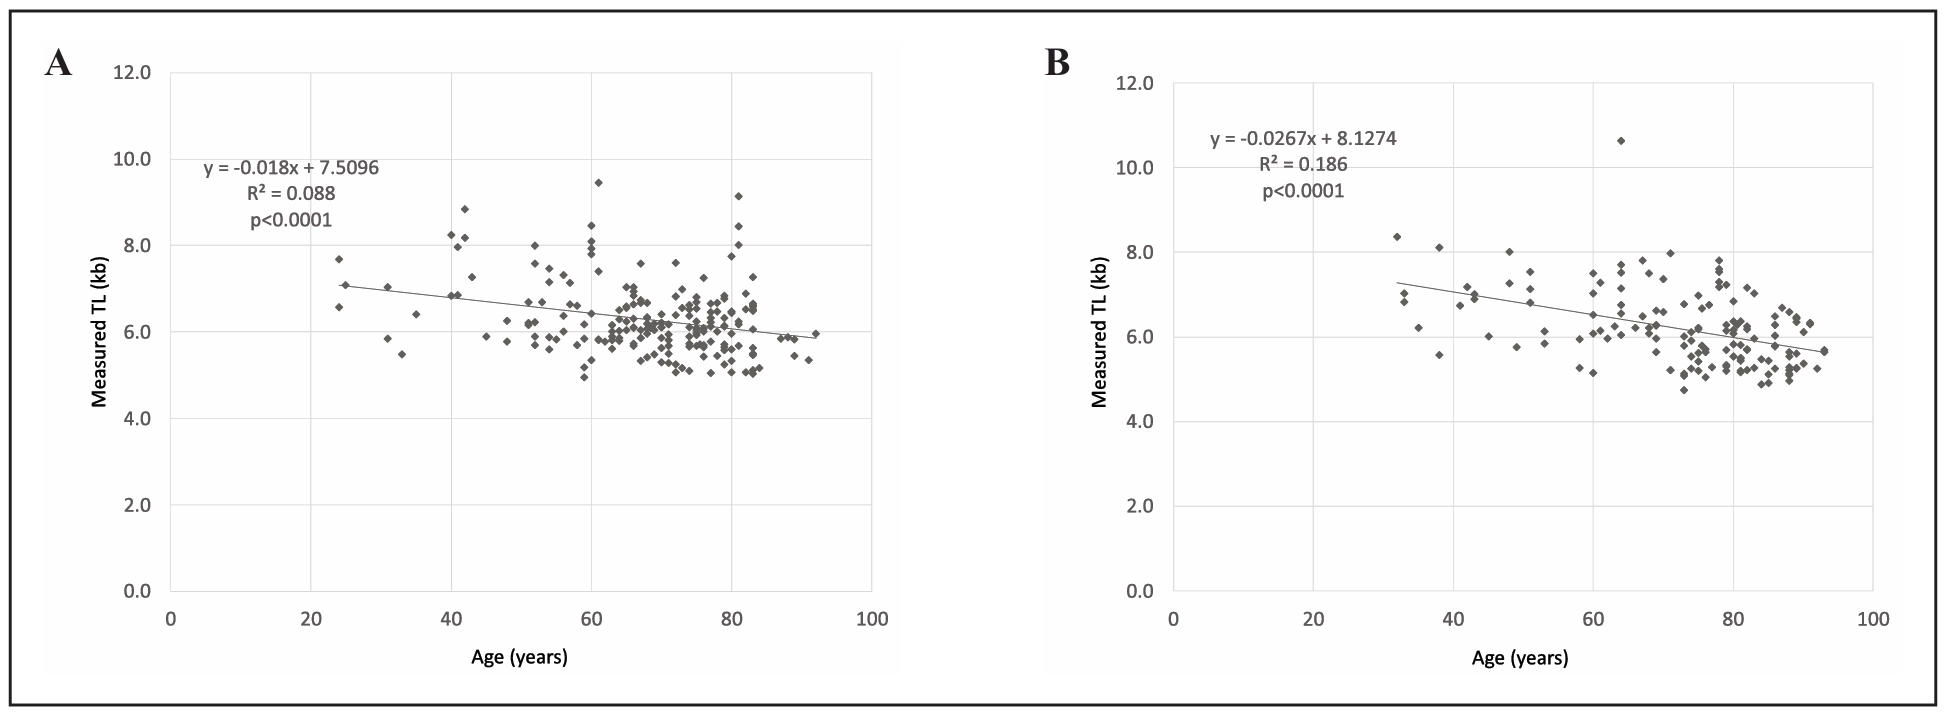
Figure 1. Correlation of age and measured TL. (A) Correlation of age and measured TL in men. The equation of the regression line and R-squared, as well as the statistical significance of the correlation, are displayed in the graph. (B) Correlation of age and measured TL in women.
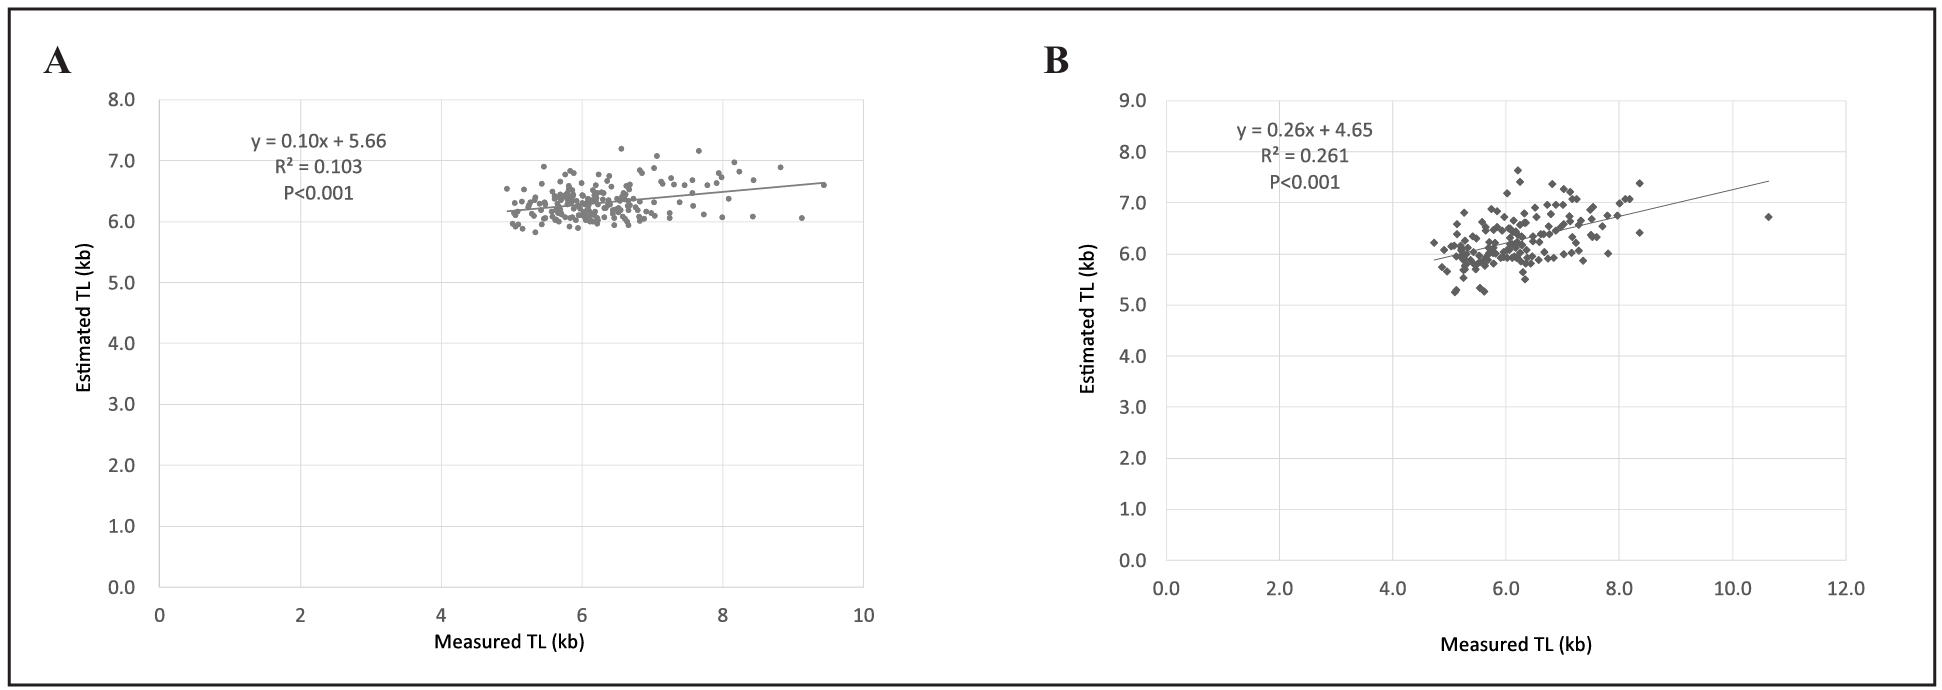
Figure 1. Correlation of eTL and measured TL. (A) Correlation of eTL and measured TL in men. The equation of the regression line and R-squared, as well as the statistical significance of the correlation, are displayed in the graph.(B) Correlation of eTL and measured TL in women.
For men, the equation was as follows: eTL (kb) = 7.0 − 0.014 × age (years) + 0.036 × (hemoglobin (g/dL) − 5)2. For women, eTL was calculated as follows: eTL (kb) = 6.2 − 0.022 × age (years) + 0.45 × serum Alb (g/dL).
Furthermore, using these data, I examined the correlation between age and eTL in nursing home residents. A significant inverse correlation was observed in both men and women (Figure 3A, C). When the analysis was restricted to residents who died of old age within the nursing home, we found no difference
in the correlation between age and eTL (Figure 3B, D).
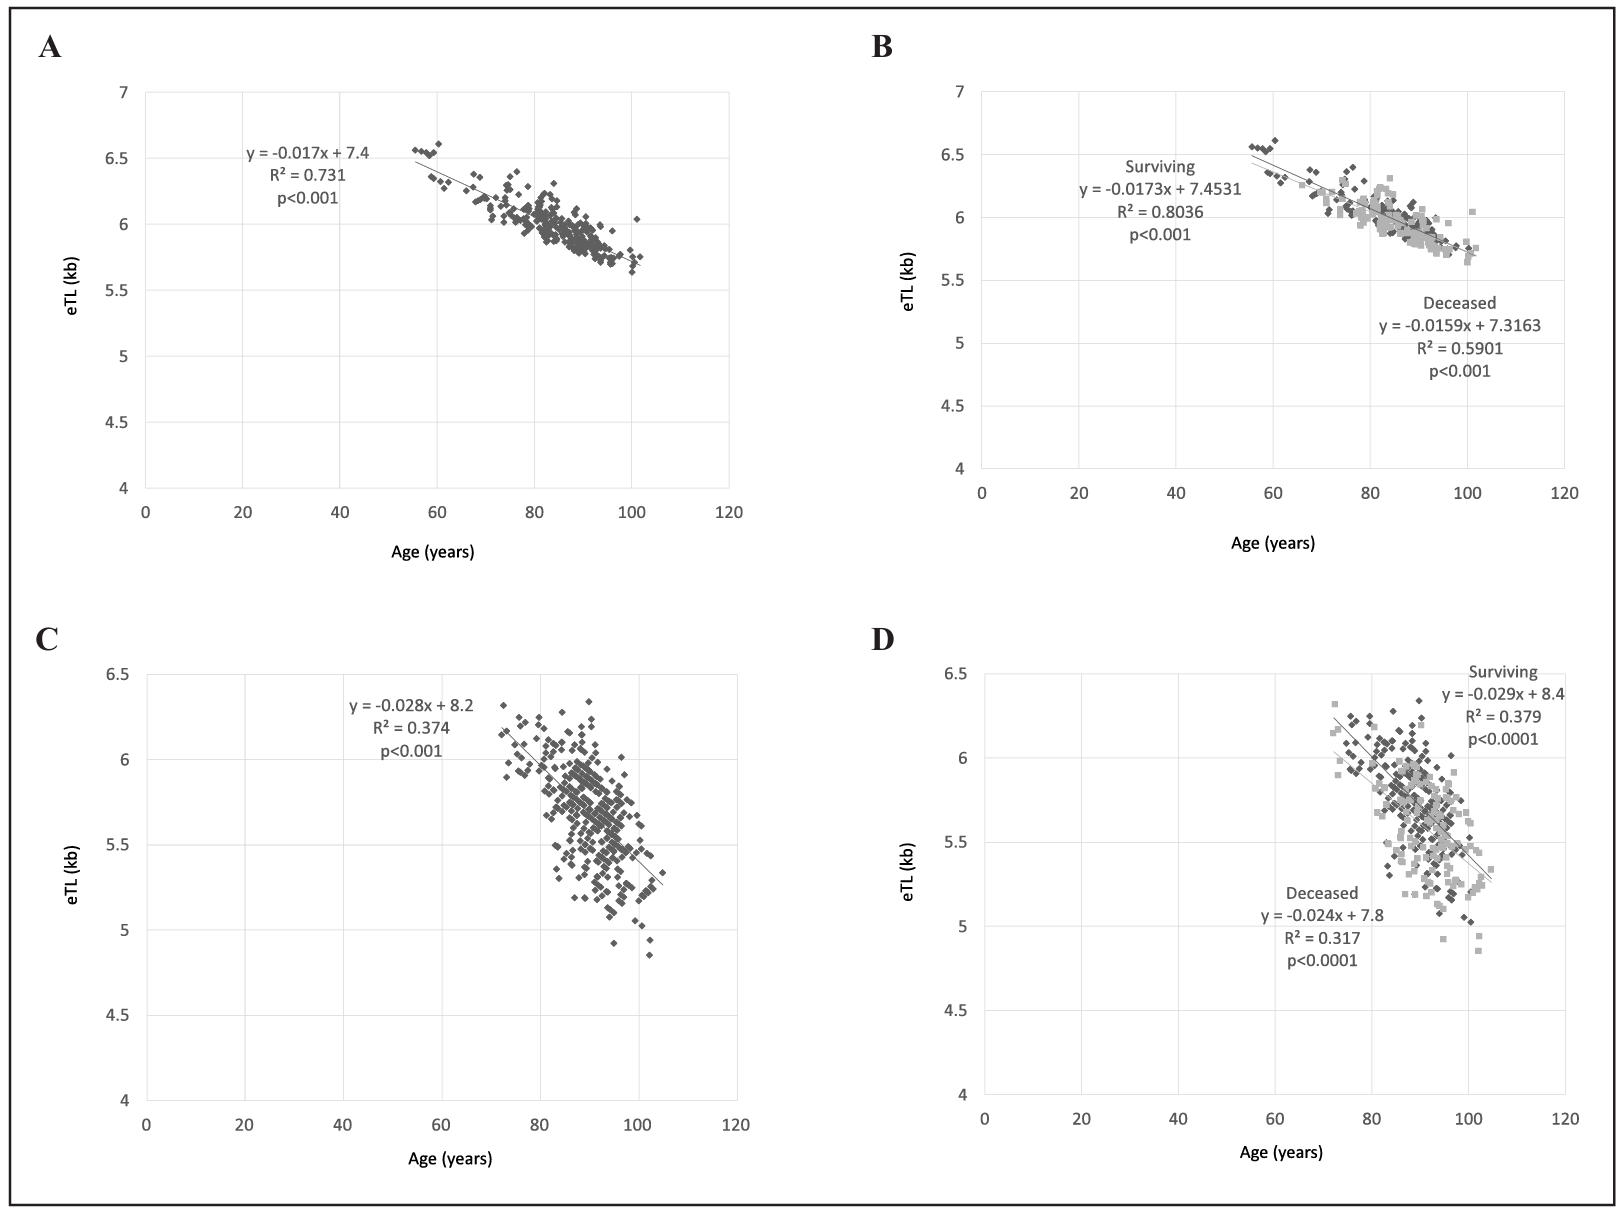
Figure 3. Correlation of age and eTL. (A) Correlation of age and eTL in men. (B) Correlation of age and eTL among surviving (black) and deceased (gray) male residents of long-term elderly care facilities.(C)Correlation of age and eTL in women. (D) Correlation of age and eTL among surviving (black) and deceased (gray) female residents of long-term elderly care facilities.
Moreover, for elderly people requiring nursing care who died while in a nursing home, I examined the correlation between the number of days from the date of blood test to death (life expectancy) and eTL calculated from the blood test results. I examined the relationship between age and life expectancy, as well as the correlation between eTL and life expectancy for both men and women. A significant correlation was observed between time to death and age in men, but not in women (Figure 4A, B). Meanwhile,eTL showed a significant decline as the date of death approached in both sexes (Figure 4C, D). Furthermore, in men, eTL was more strongly correlated with life expectancy than with age. The correlations between annual and daily TL shortening rates and age (Figure 3A, C) and life expectancy rates (Figure 4C, D) in the overall population were -0.017 (kb/year)/0.0002 × 365 (kb/year) in men and -0.028 (kb/year)/0.0003 × 365 (kb/year) in women, suggesting that TL shortening accelerates approximately fourfold from old age toward death in elderly care facility residents. In women, eTLs of < 5 kb may be observed within 100 days before death, suggesting that an eTL of ≤ 5 kb may indicate impending end of life.
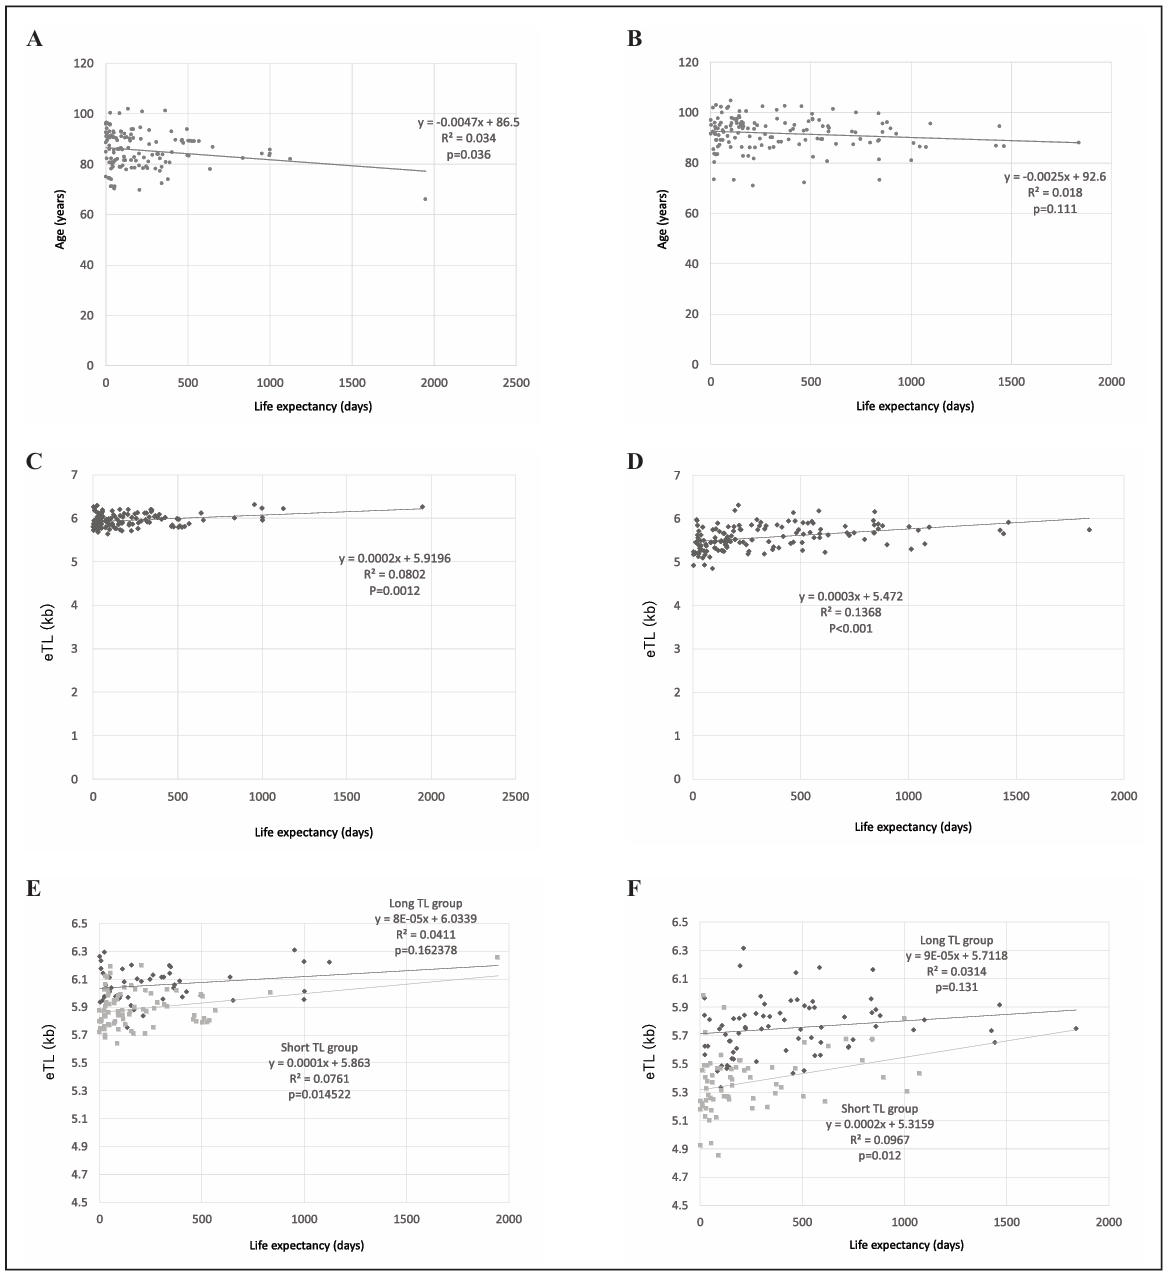
Figure 4. Correlations of age, life expectancy, and eTL. (A) Correlation of age and life expectancy in men. (B) Correlation of age and life expectancy in women.(C)Correlation of eTL and life expectancy in men.(D) Correlation of eTL and life expectancy in women.(E)Correlation of eTL and life expectancy of the long (black) and short (gray) eTL groups in men. (F) Correlation of eTL and life expectancy of the long (black) and short (gray) eTL groups in women.
Additionally, based on the y-axis intercepts in Figure 4C, D, we can estimate the life expectancy (in days) for men with a TL of ≥ 5.9 kb and for women with a TL of ≥ 5.5 kb using the following equations: (eTL − 5.9)/0.0002 for men and (eTL − 5.5)/0.0003 for women. However, these equations are an approximate estimate derived retrospectively from the number of deaths. Although it is useful as a guide, it is not universally applicable with a considerable fact that for some individuals’ life expectancy and TL do not correlate.
In accordance, few reports have shown that TL and life expectancy do not necessarily correlate in people aged < 80 years [15–17]. In the present analysis, Figure 4C, D also shows a tendency for eTL values to fluctuate more as the date of death approaches, suggesting that TL and life expectancy may not correlate in all individuals. We therefore compared the correlation between life expectancy and eTL between the long and short eTL groups
separated by the regression lines shown in Figure 3A, C. Analysis of covariance showed that the long eTL group and the short eTL group are distinct groups (P < 0.001 for both males and females). The results demonstrated that the association with life expectancy was maintained in the short eTL group, whereas it was lost in the long eTL group (Figure 4E, F).
Furthermore, the analysis of the correlation between eTL and laboratory test parameters revealed that in both men and women, a strong positive correlation was observed, particularly between albumin (Alb) and eTL. Furthermore, in the short-TL group of men, a strong positive correlation was observed between eTL and serum cholesterol (Table 2).
Discussions
FrailPow addresses a critical gap in exercise geroscience by directly comparing low- and high-load PT with traditional RT in frail older adults. Although PT is increasingly recognized for its relevance in mobility, balance recovery, and preservation of independence in aging populations [24], few trials have differentiated load-specific power modalities or examined their specific effects on muscle quality. Current evidence suggests that neuromuscular deterioration, rather than loss of muscle mass alone, contributes substantially to the functional decline observed in frailty, underscoring the need for interventions that target rate of force development and type II fiber function [14, 15].
A key contribution of FrailPow is the multidimensional operationalization of muscle quality. By integrating TMG-derived contractile properties [33], phase angle as an index of cellular integrity [34, 35], an indirect functional MQI (STS-derived) [39, 43], the protocol aligns with contemporary recommendations emphasizing combined assessment of muscle mass, quality, and function as core determinants of mobility and frailty status [11,18]. This framework moves beyond strength-only or mass-focused paradigms and enables a more comprehensive characterization of neuromuscular aging. Additionally, the selection of functional assessments is supported by reference values previously validated in the Basque Health System, including SPPB [49], GS [50], and HGS [51], reinforcing the contextual relevance of the outcomes.
The inclusion of multi-omics biomarkers represents another important methodological advance. Through genomic, transcriptomic, proteomic, and inflammatory profiling, the protocol aligns with FRAILOMIC and other European initiatives aimed at identifying biological signatures associated with frailty trajectories and responsiveness to intervention [45, 46, 52]. The incorporation of gut microbiota analysis further strengthens this integrative approach, supported by emerging evidence linking microbial ecosystems with inflammation, metabolic regulation, and muscle function in older adults [53, 54]. Together, these components position FrailPow as a precision-exercise trial capable of exploring connections between clinical adaptations and underlying biological mechanisms.
Methodologically, the protocol shows several strengths. The randomized, multicenter design with stratified allocation and blinded assessment enhances internal validity. Maintaining identical training frequency, volume, and exercise selection across intervention arms while manipulating only load and movement velocity ensures rigorous control of neuromuscular stimuli. Conducting the trial within Osakidetza increases real-world applicability and scalability within a public healthcare system. The use of a centralized digital platform for data capture supports traceability, consistency, and quality control across study sites.
From an implementation perspective, FrailPow was designed to accommodate the operational constraints commonly encountered in older adult care centers. The use of two supervised, non-consecutive training sessions per week, conservative load progression criteria, and assessment schedules distributed across separate days aims to minimize fatigue while maintaining safety and feasibility in frail populations. These design features may facilitate integration of PT approaches into routine care-center exercise programs, should effectiveness be confirmed.
Several potential limitations should be acknowledged. Heterogeneity in comorbidity burden, medication use, and baseline functional capacity may influence individual responsiveness despite stratified randomization. Participant blinding is not feasible in exercise interventions, although assessor blinding helps mitigate detection bias. The 12-week intervention and 36-week follow-up may not fully capture long-term sustainability of neuromuscular or biological adaptations. Adherence challenges may arise due to intercurrent illness or mobility constraints common in frail populations. Finally, although the integration within the Basque Health System enhances ecological validity, replication in more diverse healthcare and cultural contexts will be needed to evaluate generalizability.
Future research should examine longer-term adaptation trajectories, validate biological response profiles in larger cohorts, and explore adaptive or AI-supported exercise models. Such developments may contribute to more refined precision-exercise strategies aimed at mitigating frailty and supporting healthier aging.
Discussion
Telomere length shortening occurs not only as a normal part of aging but also accelerates under various pathological conditions [1]. We have previously reported accelerated TL shortening in various diseases, including hypertension [3], cerebrovascular
disease [4, 5], Alzheimer’s disease [6], Parkinson’s disease [7], sarcoidosis [8], diabetes [9], multiple
sclerosis [10], cancer [11], insomnia [12], and decreased physical activity [4, 14, 18]. These diverse findings suggest that
TL shortening is influenced by various physiological and pathological factors. This indicates that TL shortening is reflected in related laboratory
test parameters. Indeed, several blood test parameters have been demonstrated to correlate with TL in both patients and healthy individuals [2, 3, 5]. Therefore, we developed a TL estimation equation incorporating laboratory test parameters correlated with TL [13]. As
a next step, the present study expanded the sample size and developed a revised, simplified TL estimation equation. Among elderly care facility residents, a clear inverse correlation between age and eTL was observed for both men and women. Although this revised eTL is simpler than the first version, its correlation with the measured TL is weaker than that of the first version (male R2 = 0.234, female R2 = 0.300) [13]. In particular, the decrease in correlation is
noticeable in the male eTL, suggesting that factors other than the previously analyzed items may be influencing the results. In the female eTL, significant correlations were lost with white blood cell count (WBC) and total cholesterol (TChol), which were included in the first version of the eTL. This indicated the need to revise the first version of the eTL.
A clear inverse correlation between age and the revised eTL was observed for both the deceased and surviving elderly groups. Given that this equation includes an age term, eTL is biased toward values likely to be correlated with age, but it is expected to be a parameter that more clearly indicates aging than age. Contrarily, some studies exhibited no correlation between TL and life expectancy in the very elderly population (age ≥ 85 years) [15–17]. In the present study, we attempted to monitor the changes in TL in relation to the progression of physical aging over the period leading up to death, rather than simply in terms of the number of years since birth. The present study makes it possible to verify the correlation between TL and life expectancy in the very elderly.
Although the number of days until death is generally expected to decrease with age, this trend was not confirmed in women. Furthermore, eTL showed a significant positive correlation with the number of days until death in both men and women, with a particularly strong correlation observed in women. Thus, eTL can more accurately estimate life expectancy than age, suggesting its potential as an indicator of the aging progression. Furthermore, the present analysis predicted that TL shortening accelerates as death approaches, suggesting a decline in the ability to maintain TL with advancing age.
To examine the relationship between TL and life expectancy in more detail, we categorized the participants into those with long and short eTLs relative to their age and examined the correlation between eTL and life expectancy in each group. No correlation was found in those with long eTLs, in either men or women. This discrepancy between eTL and life expectancy may be more pronounced in very elderly individuals not residing in nursing homes, who may have longer TLs at the same age. This may mirror previous studies of TL in very elderly individuals where no correlation between TL and life expectancy was found.
Furthermore, in very old individuals for whom no correlation between eTL and life expectancy is observed, examining the correlation between measured TL and
laboratory test parameters other than age may identify the factors more closely associated with life expectancy than age itself.
In the present study, TL shortening changed concomitantly with the progression of several laboratory test parameters. It is unclear whether correcting these laboratory test parameters can directly prevent TL shortening, and whether maintaining adequate nutrition, appropriate serum albumin and appropriate serum cholesterol directly prevent TL shortening. Further research is warranted to determine whether improving the laboratory test parameters abnormalities identified in this study can actually slow TL shortening and extends the lifespan of long-lived individuals.
Conclusions and limitations
The results presented in this paper are limited and not generalizable at this time for the following reasons:
(1) The population used to formulate the new eTL mainly consists of patients treated in hospitals.
(2) The revised eTL is derived from TL measurements of a limited number of people, not a large number.
(3) The revised eTL is constructed from a single test item, which is convenient, but ignores other factors that influence telomere shortening.
(4) The life expectancy analysis using the revised eTL is based on a biased population of elderly people residing in a geriatric health services facility.
(5) The eTL of elderly people in a geriatric health services facility has not been compared with measured TL.
Therefore, to verify the conclusions of this paper, multivariate analysis is needed to examine the correlation between measured TL in a large, unbiased population and values of a wider variety of clinical test items.
Declarations
Author contributions
Maeda T contributes to data curation, formal analysis, funding acquisition, methodology, project administration, resources, software, validation, visualization, and writing of this manuscript.
Acknowledgements
The authors would like to thank Enago (www.enago.jp) for the English language review. This article was proofread with the assistance of Earth Corporation. This study was funded by a Grant-in-Aid from the Ministry of Education, Science, and Culture of Japan (#15K08919).
Financial support and sponsorship
This study was funded by a Grant-in-Aid from the Ministry of Education, Science, and Culture of Japan (#15K08919).
Conflict of interest
Not applicable.
Ethical approval and informed consent
The study on telomere length measurement using genomic DNA extracted from peripheral leukocytes, as described in this paper, was conducted with the approval of the Conjoint Health Research Ethics Board of Kyushu University (Approval number 203). The latter part of this study is an observational study using clinical data recorded during routine medical care after hospitalization. The clinical research at geriatric health services facility Tabaru was conducted with comprehensive consent regarding the use of personal data. In accordance with the Declaration of Helsinki, this facility conducts clinical research, and under the name of the facility director, it is clearly stated on the bulletin board for broad consent that personal information obtained at this facility may be used for research purposes. Furthermore, consent regarding the use of clinical data was also obtained from the residents' families at the time of hospitalization.
AI and AI-assisted tools statement
No AI tools were used in the preparation of this article.
References
1. Rossiello F, Jurk D, Passos JF, & d'Adda di Fagagna F. Telomere dysfunction in ageing and age-related diseases. Nat Cell Biol, 2022, 24(2): 135-147. [Crossref]
2. Guan J, Maeda T, Sugano M, Oyama J, Higuchi Y, & Makino N. Change in the telomere length distribution with age in the Japanese population. Mol Cell Biochem, 2007, 304(1-2): 353-360. [Crossref]
3. Maeda T, Oyama J, Sasaki M, Arima T, & Makino N. The correlation between the clinical laboratory data and the telomere length in peripheral blood leukocytes of Japanese female patients with hypertension. J Nutr Health Aging, 2011, 15(3): 240-244. [Crossref]
4. Maeda T, Oyama J, Higuchi Y, Nishiyama Y, Kudo Y, Yamori T, et al. The physical ability of Japanese female elderly with cerebrovascular disease correlates with the telomere length and subtelomeric methylation status in their peripheral blood leukocytes. Gerontology, 2011, 57(2): 137-143. [Crossref]
5. Maeda T, Oyama J, Higuchi Y, Arima T, Mimori K, & Makino N. The correlation between the telomeric parameters and the clinical laboratory data in the patients with brain infarct and metabolic disorders. J Nutr Health Aging, 2010, 14(9): 793-797. [Crossref]
6. Guan J, Guan W, Maeda T, & Makino N. Analysis of telomere length and subtelomeric methylation of circulating leukocytes in women with Alzheimer's disease. Aging Clin Exp Res, 2013, 25(1): 17-23. [Crossref]
7. Guan J, Maeda T, Sugano M, Oyama J, Higuchi Y, Suzuki T, et al. A percentage analysis of the telomere length in Parkinson's disease patients. J Gerontol A Biol Sci Med Sci, 2008, 63(5): 467-473. [Crossref]
8. Guan J, Maeda T, Sugano M, Oyama J, Higuchi Y, Suzuki T, et al. An analysis of telomere length in sarcoidosis. J Gerontol A Biol Sci Med Sci, 2007, 62(11): 1199-1203. [Crossref]
9. Makino N, Maeda T, & Abe N. Short telomere subtelomeric hypomethylation is associated with telomere attrition in elderly diabetic patients. Can J Physiol Pharmacol, 2019, 97(4): 335-339. [Crossref]
10. Guan J, Guan W, Maeda T, Guoqing X, GuangZhi W, & Makino N. Patients with multiple sclerosis show increased oxidative stress markers and somatic telomere length shortening. Mol Cell Biochem, 2015, 400(1-2): 183-187. [Crossref]
11. Maeda T, Nakamura K, Atsumi K, Hirakawa M, Ueda Y, & Makino N. Radiation-associated changes in the length of telomeres in peripheral leukocytes from inpatients with cancer. Int J Radiat Biol, 2013, 89(2): 106-109. [Crossref]
12. Maeda T, Horiuchi T, & Makino N. Telomere shortening velocity of patients administered with hypnotics is accelerated in a gender-differential manner. Can J Physiol Pharmacol, 2021, 99(3): 278-283. [Crossref]
13. Maeda T, Horiuchi T, & Makino N. The approximate formulas predicting personal somatic telomere length using patient blood test data. Can J Physiol Pharmacol, 2019, 97(11): 1090-1093. [Crossref]
14. Maeda T. The estimation of the clinical status of the residents in a geriatric health service facility in Japan. Aging Pathobiol Ther, 2025, 7(4): 123-128. [Crossref]
15. Martin-Ruiz C, Gussekloo J, van Heemst D, von Zglinicki T, & Westendorp R. Telomere length in white blood cells is not associated with morbidity or mortality in the oldest old: a population-based study. Aging Cell, 2005, 4(6): 287-290. [Crossref]
16. Wang Q, Zhan Y, Pedersen N, Fang F, & Hägg S. Telomere length and all-cause mortality: a meta-analysis. Ageing Res Rev, 2018, 48: 11-20. [Crossref]
17. Martin-Ruiz C, Jagger C, Kingston A, Collerton J, Catt M, Davies K, et al. Assessment of a large panel of candidate biomarkers of ageing in the Newcastle 85+ study. Mech Ageing Dev, 2011, 132(10): 496-502. [Crossref]
18. Maeda T, Horiuchi T, & Makino N. Shorter somatic telomere can be an increased risk for hospitalization. Mol Cell Biochem, 2019, 455(1-2): 1-5. [Crossref]