Open Access | Research
This work is licensed under a Creative Commons Attribution-ShareAlike 4.0 International License.
Genetic drift and selective pressures shaping mitochondrial ND3 variants m.10398A>G and m.10400C>T: implications for type 2 diabetes risk in India population
* Corresponding author: Jwalant Waghmare
Mailing address: Mahatma Gandhi Institute of Medical Sciences,
Sevagram, Wardha, Maharashtra, India.
Email: jewaghmare@mgims.ac.in
Received: 18 May 2026 / Revised: 03 June 2026 / Accepted: 17 June 2026 / Published: 30 June 2026
DOI: 10.31491/APT.2026.06.220
Abstract
Background:
Mitochondrial DNA (mtDNA) variants influence cellular energy metabolism and are implicated in metabolic diseases such as type 2 diabetes (T2D). Environmental factors, including diet and lifestyle, may shape the frequency and selection of these variants across populations. This study investigates the distribution and potential selective pressures on mtDNA variants m.10398A>G and m.10400C>T in an Indian cohort, assessing their association with T2D susceptibility.
Methods:
We conducted a case-control analysis involving 206 T2D patients and 156 healthy controls to assess the frequency distribution of two significant mtDNA variants: m.10398A>G and m.10400C>T. The participants were stratified into two age groups: < 60 years and ≥ 60 years, to study the associations of age-related mitochondrial changes. The variants were genotyped using Sanger sequencing technology. We performed variant calling, multiple sequence alignment, and evolutionary conservation analysis (ConSurf). Additionally, we conducted structural impact predictions using PolyPhen-2 and protein modeling with SWISS-MODEL. For statistical analysis, we used chi-square tests along with odds ratios (OR) and 95% confidence intervals (CI) to assess differences in variant frequencies.
Results:
The m.10398A>G variant results in a threonine-to-alanine substitution at amino acid 114, while m.10400C>T is a synonymous mutation. Both variants exhibited positive linkage disequilibrium and were significantly more frequent in T2D patients compared to controls (m.10398A>G: 67.0% vs. 51.3%, OR = 1.929, P = 0.0026; m.10400C>T: 65.5% vs. 48.1%, OR = 2.052, P = 0.0009). PolyPhen-2 predicted these variants as benign, though the amino acid change at m.10398A>G may affect complex I function. The findings suggest these variants may be influenced by selective pressures related to regional environmental and dietary factors independent of aging, contributing to T2D pathogenesis.
Conclusion:
These findings suggest the influence of regional environmental and dietary factors, genetic drift, and selection pressures on mtDNA variant distribution. In addition, the findings underscore the importance of considering haplogroup background and population-specific dynamics in understanding mtDNA’s role in T2D susceptibility.
Keywords
mtDNA, m.10398A>G, m.10400C>T, genetic drift, type 2 diabetes
Introduction
The complex interplay between environmental factors (particularly dietary habits) and mitochondrial DNA (mtDNA) variations provides a basis for evolution and its impact on human genetic diversity and associated traits [1]. Mitochondrial DNA (mtDNA), which is maternally inherited, plays a vital role in cellular energy production,
calcium homeostasis, immune response, epigenetic regulation, apoptosis, and many other metabolic and signaling processes, and has been found to harbor a range of variants that significantly influence an individual’s susceptibility to various metabolic
diseases [2]. These mtDNA variants accumulate over an individual’s lifetime through cell division and mitochondrial turnover. However, in disease conditions, some mtDNA mutations can drift to high frequencies within specific cell subpopulations.
This leads to mitochondrial heteroplasmy, where mutations are present in a subset of mtDNA molecules within a cell or tissue, increasing the detrimental variant and leading to positive selection at the cellular level as they age [3]. This is due to the highly mutable
nature of mitochondria, which have an estimated mutation rate of 2 to 20 times that of nuclear DNA [4]. This high mutation rate is further compounded by high inherited mtDNA diversity and the generation of somatic mutations. Together, these factors contribute to the
mitochondrial genetic bottleneck, a phenomenon generally believed to result from random genetic drift influenced by dietary habits and other environmental factors, such as a sedentary lifestyle [5].
In ecological systems, macronutrient composition within dietary intake serves as a significant selective pressure both intra- and inter-populationally, which could alter complex I dynamics through changes in dietary choices, thereby impacting mitochondrial bioenergetics and organismal fitness [6]. The dietary macronutrient composition can alter the selective
pressures on mtDNA haplotypes, influencing their frequency in a population. This interaction is complex and involves various mechanisms, including changes in mitochondrial function, retrograde signaling to the nuclear genome, and epigenetic modifications. Thus, this macronutrient ratio potentially influences allele frequencies and population migration dynamics, thereby shaping the evolutionary trajectories of mtDNA haplogroups.
Therefore, studying genetic variations among populations is crucial for understanding region-specific evolutionary influences, potential health implications, and the development of targeted healthcare strategies. During our previous research on mitochondrial mutations in patients with type 2 diabetes (T2D), we identified two notable single-nucleotide polymorphisms (SNPs) present in both T2D patients and control individuals from the Indian population.
The remarkable consistency of these sequence variants across all samples indicates region-specific environmental conditions and dietary patterns. In addition, other factors may shape allele frequency, including aging, genetic drift, natural selection, and gene flow [7]. Despite functional evidence linking complex I variants to mitochondrial respiratory chain dysfunction and their reported presence in T2D cases in some Indian cohorts,
comprehensive population-level variant frequency distributions across Indian subpopulations are limited. The present study aims to characterize the frequency distribution of the m.10398A>G and m.10400C>T variants and evaluate the evidence for genetic drift versus selection in determining their contemporary frequencies in relation to T2D susceptibility.
Methodology
This case-control design study analyzed genetic data from 206 T2D patients and 156 healthy controls (aged 45–84) to assess the association between m.10398A>G and m.10400C>T variants with disease risk. T2D individuals were evaluated following WHO guidelines, while healthy participants were selected based on the absence of disease and not currently undergoing treatment for any recent medical condition. Prior to participating in the study, all participants signed a consent form, and anthropometric measurements were collected and registered at the Department of Medicine, Mahatma Gandhi Institute of Medical Sciences, Sevagram. This study was approved by the Institutional Ethics Board (MGIMS/IEC/ANAT/79/2019).
Peripheral blood samples were collected and subjected to DNA isolation procedures. The QIAamp Blood Mini Kit (QIAGEN) was used, and extraction was performed according to the manufacturer’s instructions. The isolated mtDNA samples were subsequently used for PCR amplification with NADH dehydrogenase subunit 3 (ND3) region-specific primers F: 5’-TCCTTTTACCCCTACCATGAG-3’ and R: 5’-GGAGTGGGTGTTGAGGTT-3’, annealed at 60°C.
The PCR master mix, prepared in a 25 μL reaction volume, comprised PCR buffer, 1.5 mM MgCl₂, 10 pmol of each forward and reverse primer, 2.5 mM of each dNTP, 5 U of Taq DNA polymerase (Thermo Fisher Scientific), and 10 ng of genomic DNA. The resulting PCR products were subjected to Sanger sequencing (Genetic Analyser, Applied Biosystems) using the BigDye Terminator v3.1 kit. Variant calling was performed using the Variant Reporter and Sequencing Analysis Software v7.0 (Thermo Fisher Scientific).
Multiple sequence alignment was conducted using the Multiple Alignment using Fast Fourier Transform (MAFFT) online tool ( https://mafft.cbrc.jp/alignment/server/index.html). The data input consisted of sequencing files aligned with the mtDNA reference sequence sourced from the Revised Cambridge Reference Sequence (rCRS) NC_012920 (GRCh38), facilitating the detection of mutations. ConSurf was used to examine the evolutionarily conserved
amino acids within the MT-ND3 gene of the NADH-ubiquinone oxidoreductase chain 3 protein. ConSurf uses a multiple sequence alignment of homologues to allocate a conservation score to each amino acid, which is visually represented by a color-coded scale. Scores of 8–9 represent highly conserved residues. To assess the structure and function of MT-ND3 mutations on complex I, PolyPhen-2 was utilized (version 2.2.2). Furthermore, the SWISS-MODEL online tool (https://swissmodel.expasy.org/) was employed to visualize and analyze the three-dimensional structure of the protein.
Statistical analysis was performed using GraphPad Prism (version 10.00). χ2 tests were used to compare the frequency distribution of mtDNA variants among the groups. In addition, to evaluate whether the observed associations were influenced by age-related mitochondrial changes, participants were stratified into two age groups: < 60 years
and ≥ 60 years. The frequencies of m.10398A>G and m.10400C>T variants were compared between T2D patients and healthy controls within each age stratum. Odds ratios (ORs) and 95% confidence intervals (CIs) were calculated to estimate the association strength. Fisher’s exact test was used to assess statistical significance, with P-value < 0.05 considered significant.
Result
The protein coding region corresponding to the mitochondrial variants of ND3 was aligned according to the translational frame. Conservation analysis (ConSurf) and rCRS were used as the reference sequences for the protein and mitochondrial genome, respectively. In comparison to both references, it was observed that 5% (based on the conservation scale, ConSurf) and 51.11% (rCRS) represented the average conserved nucleotide positions. According to the Human Mitochondrial Genome Database (MITOMAP) database, the variant m.10400C>T translates to 114 amino acids without any amino acid change, from threonine to threonine, while at the same position, variant m.10398A>G modifies the amino acid from threonine to alanine. Thus, the alteration is primarily attributed to the 10398G variant, which changes an amino acid, rather than the 10400T variant, due to its wobble position and synonymous mutation. In our population, these variants show positive linkage disequilibrium, suggesting that these variants may have been subjected to selective pressures, potentially influencing their prevalence in T2D susceptibility [8] (Figure 1).
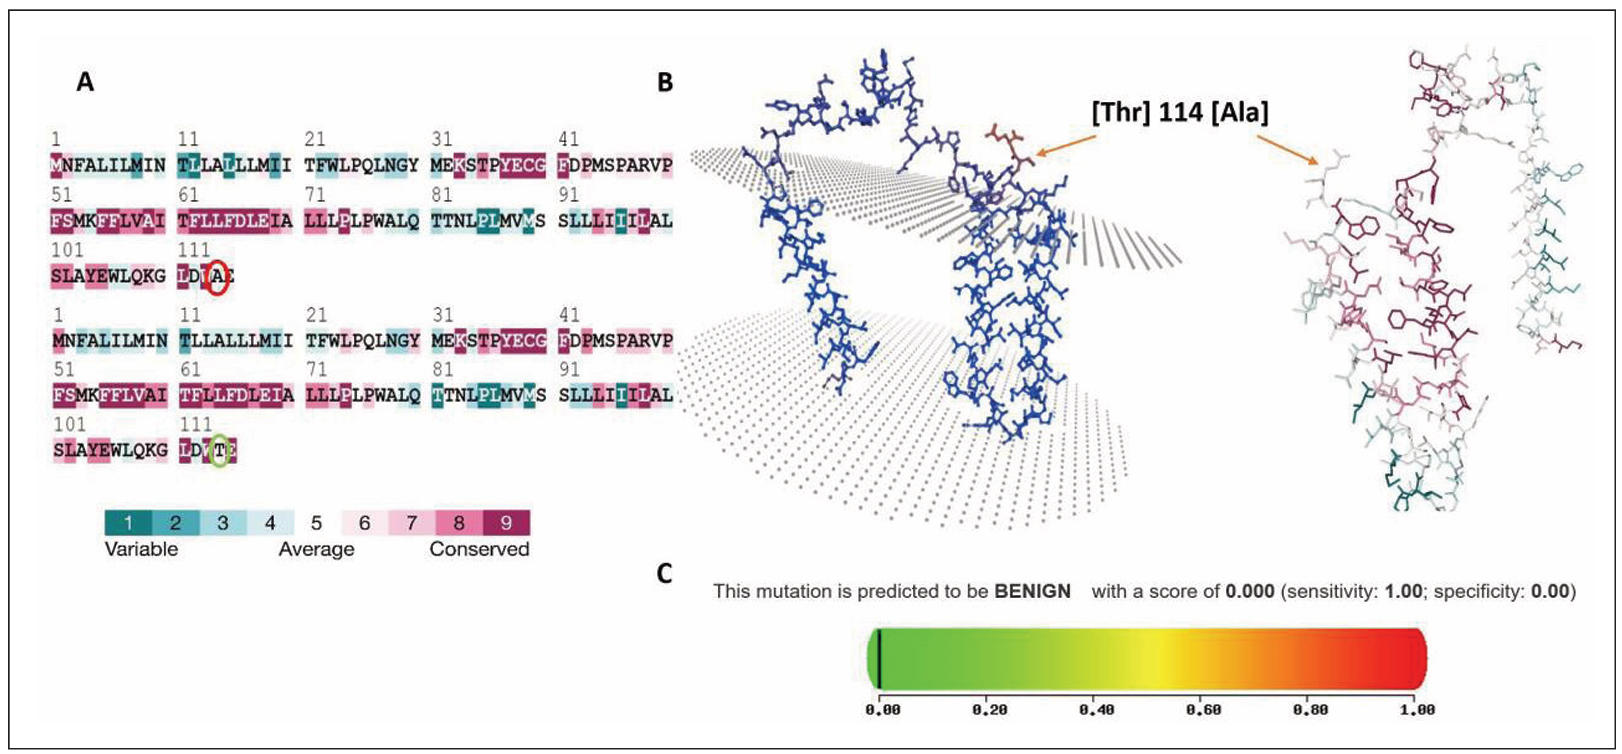
Figure 1. Conservation analysis, structural mapping, and pathogenicity prediction of MT-ND3 Thr114Ala variant. (A) ConSurf 3D model sequence alignment of the MT-ND3 protein, highlighting residue conservation. The threonine (Thr) at position 114 is marked (green circle), demonstrating its evolutionary conservation and substitution with alanine (Ala) in the variant sequence (red circle). The color coding represents the degree of conservation, ranging from variable to highly conserved. (B) Three-dimensional structural representation of MT-ND3 protein showing the spatial localization of the Thr114Ala substitution. The variant residue is indicated within the protein structure, illustrating its position relative to the surrounding amino acids and potential structural domains. (C) Polyphen2, in silico pathogenicity prediction of the Thr114Ala variant, indicating a benign effect, with a score of 0.000 (sensitivity: 1.00; specificity: 0.00), as represented by the color gradient scale.
The mtDNA variants m.10398A>G (ND3, p.Thr114Ala) and m.10400C>T (ND3, p.Thr114Thr) were significantly more frequent in T2D patients than in healthy controls (Table 1). In our cohort, A10398G was present in 138/206 (67.0%) diabetic individuals versus 81/158 (51.3%) healthy controls (OR = 1.929, 95% CI 1.265–2.969, P = 0.0026). Similarly, C10400T occurred in 135/206 (65.5%) diabetic individuals versus 76/158 (48.1%) controls (OR = 2.052, 95% CI 1.352–3.147, P = 0.0009). The observed frequencies of these mtDNA variants suggest a potential role in the pathogenesis of T2D, warranting further investigation into their functional implications using a cybrid model (Table 1, Figure 2).
Table 1.
carcinoma.
| Sr No | Variants locus position | Amino acid alteration | T2D patients (N = 206) | Healthy controls (N = 158) | OR | 95% CI | P-value |
|---|---|---|---|---|---|---|---|
| 1 | A10398G | Thr>Ala | 138 | 81 | 1.929 | 1.265–2.969 | 0.0026* |
| 2 | C10400T | Thr>Thr | 135 | 76 | 2.052 | 1.352–3.147 | 0.0009* |
Note: T2D, type 2 diabetes; OR, odds ratio; CI, confidence interval. p-values were calculated using Fisher's exact test. * Statistically significant at P < 0.05.
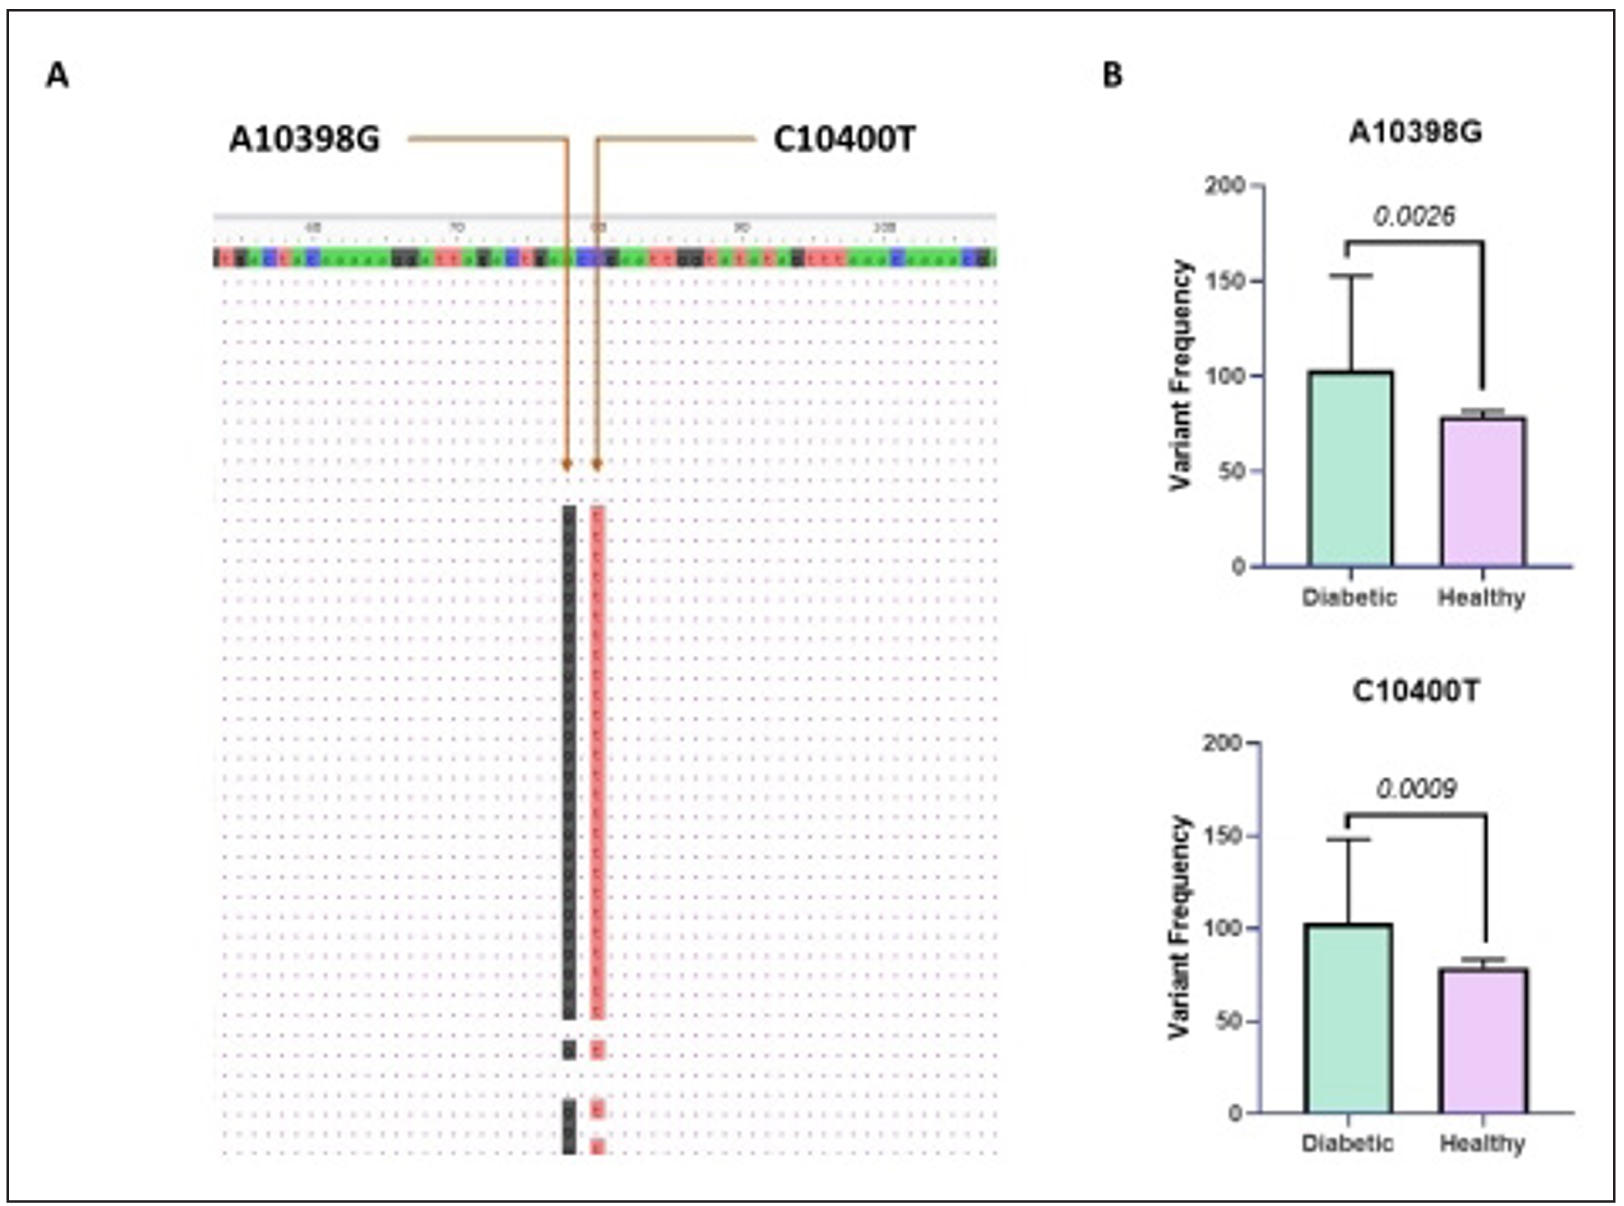
Figure 2. Comparative frequencies of mitochondrial DNA variants A10398G and C10400T in diabetic and healthy individuals. (A) Representative multiple sequence alignment showing the detection of two mitochondrial Single Nucleotide Variant (SNVs), A10398G and C10400T, within the analyzed region. Arrows indicate the exact nucleotide positions of the variants identified by sequence mapping. (B) Comparative analysis of variant frequencies between the diabetic and healthy cohorts. Bar graphs illustrate the distribution of A10398G and C10400T variants, demonstrating a higher prevalence in the diabetic cohorts compared to healthy controls. Error bars represent standard deviation, indicating variability within each group.
In addition, the cohort was stratified into two groups: < 60 years and ≥ 60 years, to determine whether the observed association was independent of age. For m.10398A>G, no significant association with T2D was observed among participants aged < 60 years (OR = 1.132, 95% CI 0.702–1.780; P = 0.6362). Among participants aged ≥ 60 years, a stronger effect size was observed (OR = 8.125, 95% CI 1.654–37.690; P = 0.0301). Similarly, m.10400C>T was not associated with T2D in participants aged < 60 years (OR = 1.082, 95% CI 0.678–1.729; P = 0.8148). In contrast, among participants aged ≥ 60 years, the variant demonstrated a significant association with T2D (P = 0.0006) (Table 2).
Table 2.
Age-stratified association of mtDNA variants m.10398A>G and m.10400C>T with type 2 diabetes susceptibility.
| Variant | Age group | T2D, variant positive (N) | T2D, variant negative (N) | Control, variant positive (N) | Control, variant negative (N) | OR | 95% CI | P-value |
|---|---|---|---|---|---|---|---|---|
| m.10398A>G | < 60 years | 73 | 62 | 77 | 74 | 1.132 | 0.701–1.780 | 0.6362 |
| m.10398A>G | ≥ 60 years | 65 | 6 | 4 | 3 | 8.125 | 1.654–37.690 | 0.0301* |
| m.10400C>T | < 60 years | 70 | 71 | 72 | 79 | 1.082 | 0.678–1.729 | 0.8148 |
| m.10400C>T | ≥ 60 years | 65 | 0 | 4 | 3 | 101.889 | 4.529–2292.191 | 0.0006** |
Note: T2D, type 2 diabetes; OR, odds ratio; CI, confidence interval. p-value were calculated using Fisher's exact test. * Statistically significant at P < 0.05; **statistically significant at P < 0.001.
Discussions
In T2D, aging is a major risk factor, largely contributed to by the gradual deterioration of mitochondrial function, increased oxidative stress, chronic low-grade inflammation, and impaired insulin signaling.
These dysregulations reduce skeletal muscle oxidative capacity and ATP synthesis, contributing to insulin resistance, while β-cell senescence increases susceptibility to oxidative damage [9–11]. These declines in mitochondrial functions, heightened reactive oxygen species (ROS) due to aging, further contribute to visceral fat and adipose tissue inflammation, exacerbating metabolic dysfunction. mtDNA variants such as m.10398A>G likely increase individual susceptibility to T2D and its progression into complications [12].
In this study, we investigated the association between mtDNA variants, m.10398A>G and m.10400C>T, and susceptibility to T2D in the Indian population. Our findings reveal a potential link between these genetic alterations and disease pathogenesis. This indicates that these variants may have been subjected to selective pressures, potentially shaped by unique environmental and dietary factors prevalent in the region.
Owing to heteroplasmy, mtDNA exists in multiple copies in a combination of wild-type and mutant mtDNA molecules within either the same mitochondrion or across different mitochondria in a cell. As a result, Sanger sequencing chromatograms can display multiple nucleotide peaks at a single position, indicating the presence of more than one variant [13]. In our investigation, however, we identified single-nucleotide variant (SNV) at each position, implying that heteroplasmy was below
the detection threshold of the Sanger sequencing (10–20%) [14]. Analysis of the sequencing data revealed that these variants are prevalent in our population.
The m.10398A>G and m.10400C>T polymorphisms within the ND3 gene translate to the amino acid substitutions Thr114Ala and Thr114Thr, respectively. PolyPhen-2 suggests that these polymorphisms are benign and do not influence the structural integrity of the protein, as they reside within a relatively neutral, conserved domain of the protein. Nevertheless, the substitution of an uncharged, polar threonine with a hydrophobic alanine residue at m.10398A>G may affect the function of complex I. The experimental studies suggest that it can influence mitochondrial bioenergetics, ROS production, and retrograde signaling. The modelling and expression quantitative trait locus analyses have demonstrated that m.10398A>G is associated with altered expression of complex I and its associated genes, including ATP8, ND2, ND4L, ATP6, CYB, and ND4, specifically, significantly associated with lower expression and increased mitochondrial heteroplasmy [15].
In addition, cybrid studies have shown that macrohaplogroups M and N, distinguished in part by these variants, differ in respiratory activity, NAD+/NADH ratios, and ROS levels. Interestingly, these variants exhibit increased mtDNA replication, RNA transcription, and cellular respiration, ultimately leading to electron leakage from the electron transport chain (ETC), resulting in elevated ROS. In diabetic conditions, this cascade places a heavy burden on the ETC, which renders this variant pathogenic [16]. In addition, a sedentary lifestyle and elevated levels of diabetogenic factors (insulin resistance, visceral obesity, and hyperglycemia), combined with aging, accelerate the frequency of this genetic background variant many-fold [17]. Such alterations contribute to mitochondrial dysfunction, genomic instability, cellular senescence, and dysregulated nutrient sensing. Consequently, m.10398A>G may represent a functional modifier of age-related mitochondrial performance, potentially influencing susceptibility to metabolic disorders such as T2D.
Individuals harboring the m.10398A>G variant are linked to accelerated aging in young adults, correlating with older epigenetic and biological ages by their 20s, independent of sex, body mass index (BMI), and substance use. This variant, a defining feature of the J-T macrohaplogroup, contributes to a higher overall functional impact score burden, predisposing to premature biological aging and increasing potential susceptibility to age-related degenerative diseases [18]. In addition, a study of healthy sedentary individuals revealed reduced mitochondrial respiration, up to 36% decline in complex I activity, and a 51% decline in carnitine palmitoyltransferase I activity. Additionally, the study observed a notable dual-substrate bottleneck reduction in mitochondrial pyruvate and fatty acid oxidation, correlating with increased risk of developing cardiometabolic diseases and T2D [5]. Age-related mitochondrial variants, such as m.1382A>C, are found in 5–10% of East Asian populations. This indicates that the m.1382A>C variant is associated with lower levels of MOTS-c, a mitochondrial-derived peptide. Specifically, individuals in middle age (45–55 years) show 11% lower levels of circulating MOTS-c, while older adults (70–81 years) exhibit a 21% reduction compared to younger individuals (18–30 years). This suggests that mitochondrial-derived peptides naturally decline with age, and the accumulation of visceral fat due to a sedentary lifestyle increases the risk of T2D [19, 20].
Given the established role of aging in mitochondrial dysfunction and T2D pathogenesis, the findings show that neither m.10398A>G nor m.10400C>T was significantly associated with T2D among participants < 60 years. Interestingly, larger effect sizes were observed in participants aged ≥ 60 years, limiting the statistical precision, though suggesting that the impact of these variants may become more apparent in the context of age-related mitochondrial alterations.
The stratified age and the lower samples of the age ≥ 60-year group indicated that these variants were caused by diabetogenic factors and genetic predisposition independent of aging. The duration of T2D may alter the normal nucleotide position into the single nucleotide variant (SNV). However, the statistical observations are consistent with the hypothesis that aging may modify the phenotypic effects of mitochondrial variants. However, this finding warrants larger age-matched cohorts to validate this effect. Cumulatively, the age-stratified analysis addresses the potential confounding effect of age and
provides additional evidence regarding the interaction between mitochondrial
genetic variation, aging, and susceptibility to T2D.
In numerous populations, these variants have a flip-flop effect, yielding population-specific patterns. Several independent studies in Indian populations have reported significant associations between the m.10398A allele and increased T2D risk, with odds ratios of 2.83 for the m.10398A allele and 9.489 for the m.10398G [21, 22]. In contrast, studies in East Asian cohorts have produced divergent results, with the m.10398G allele found more frequently in control subjects in the Chinese Han population [23]. These discordant findings underscore the importance of considering haplogroup background, as these variants serve as phylogenetically informative markers that help distinguish macrohaplogroups M and N, with m.10400C>T functioning as a defining marker of haplogroup M, which is
common in East and South Asian populations [16]. This reversal of risk association across different genetic cohorts is indicative of a flip-flop phenomenon, which underscores the importance of considering the microhaplogroup background and local gene-environment interactions.
The global distribution of MT-ND3 variants exhibits substantial geographic heterogeneity, with variants at position 10398 accounting for approximately 41.8% of cases worldwide. The Indian subcontinent presents a particularly informative context for understanding mitochondrial genetic drift due to its complex demographic history, extensive population substructure, and long-term endogamy [24]. India’s maternal gene pool is dominated by macrohaplogroup M, and regional studies provide clear examples of founder effects and bottlenecks that create large drift signals in maternal lineages, creating conditions in which pathogenic or nearly neutral mtDNA variants can be randomly fixed at high frequencies through genetic drift [25].
This finding supports the hypothesis that certain mtDNA variants facilitate adaptation to various geographical and diet-specific conditions independent of aging, enabling the regional enrichment of certain mtDNA lineages through selective pressure. The observed mtDNA variants could play an essential role in determining the energy utilization and metabolic efficiency of the Indian population. Future studies should aim to determine how these variants differ across diverse cohorts with distinct regional dietary practices. Further, a qualitative and quantitative evaluation of these variants in vivo and vitro models could validate these computational assumptions and provide deep insights into the proposed hypothesis. Additionally, genome-wide association studies would be warranted to enrich the other
variant burden in understanding the genetic and environmental factors shaping the diversity and disease condition.
Conclusions
In conclusion, this study demonstrates that m.10398A>G (Thr114Ala) and m.10400C>T (Thr114Thr) are significantly associated with T2D susceptibility in the Indian population, with age-stratified analysis revealing stronger associations in individuals aged ≥ 60 years. The population-specific distribution of these variants, shaped by genetic drift and selective pressures, underscores the importance of haplogroup background and gene-environment interactions. Larger age-matched cohort studies and functional investigations using in vivo and in vitro models are warranted to validate these findings and elucidate the mechanistic pathways linking mitochondrial variants to T2D pathogenesis.
Declarations
Author contributions
Tajane T performed the experiments, analyzed, and interpreted the data, and wrote the original draft. Ambulkar P, Chandrakar M, and Waghmare J contributed to experiments, analyzed, and interpreted the data, and edited the manuscript. Waghmare P and Taksande B provided the study samples. Waghmare J conceptualized and supervised the manuscript. All authors reviewed and approved the article.
Availability of data and materials
Data will be available upon reasonable request.
Financial support and sponsorship
This work was financially supported by the Indian Council of Medical Research (ICMR), New Delhi, India (5/4/5-10/Diab./20-NCD-III). JW is grateful to the funding agency for this financial grant.
Conflicts of interest
Authors declare no conflict of interest.
Ethical approval and informed consent
All participants have provided written informed consent prior to enrolment.
Consent for publication
Not applicable.
AI and AI-assisted tools statement
During the preparation of this work, no AI tools were used.
References
1. Ferreira T, & Rodriguez S. Mitochondrial DNA: inherent complexities relevant to genetic analyses. Genes, 2024, 15(5): 617-628. [Crossref]
2. Wen H, Deng H, Li B, Chen J, Zhu J, Zhang X, et al. Mitochondrial diseases: from molecular mechanisms to therapeutic advances. Signal Transduct Target Ther, 2025, 10(1): 9-22. [Crossref]
3. Kuiper L, Shi W, Verlouw J, Hong Y, Arp P, Puiu D, et al. Deleterious mitochondrial heteroplasmies exhibit increased longitudinal change in variant allele fraction. iScience, 2025, 28(6): 112590. [Crossref]
4. Árnadóttir E, Moore K, Guðmundsdóttir V, Ebenesersdóttir S, Guity K, Jónsson H, et al. The rate and nature of mitochondrial DNA mutations in human pedigrees. Cell, 2024, 187(15): 3904-3918.e3908. [Crossref]
5. San-Millán I, Martinez J, Sparagna G, D'Alessandro A, Stefanoni D, Nemkov T, et al. Decreased mitochondrial bioenergetics and function define a distinct metabolic phenotype in healthy sedentary individuals detectable through non-invasive CPET. bioRxiv [Preprint], 2024, Available from:https://doi.org/10.1101/2024.08.19.608601
6. Aw W, Garvin M, & Ballard J. Exogenous factors may differentially influence the selective costs of mtDNA mutations. Adv Anat Embryol Cell Biol, 2019, 231: 51-74. [Crossref]
7. Chen N, Juric I, Cosgrove E, Bowman R, Fitzpatrick J, Schoech S, et al. Allele frequency dynamics in a pedigreed natural population. Proc Natl Acad Sci USA, 2019, 116(6): 2158-2164. [Crossref]
8. Tajane T, Chandrakar M, Ambulkar P, Waghmare P, Taksande B, & Waghmare J. Mitochondrial ND3, tRNA (Leu) and hypervariable region I: variants in type II diabetes patients from the central rural Indian population. Hum Gene, 2026, 47: 201520. [Crossref]
9. Chaudhary R, Khanna J, Rohilla M, Gupta S, & Bansal S. Investigation of pancreatic-beta cells role in the biological process of ageing. Endocr Metab Immune Disord Drug Targets, 2024, 24(3): 348-362. [Crossref]
10. Heydarpour M, Pojoga L, Romero J, Williams G, & Williams J. SAT077 Association of mitochondrial DNA with type-2-diabetes, glucose level, and insulin resistance. J Endocr Soc, 2023, 7(Supplement_1): bvad114.943. [Crossref]
11. Iheagwam F, Joseph A, Adedoyin E, Iheagwam O, & Ejoh S. Mitochondrial dysfunction in diabetes: shedding light on a widespread oversight. Pathophysiology, 2025, 32(1): 9-24. [Crossref]
12. Mabalirajan U, & Ghosh B. Mitochondrial dysfunction in metabolic syndrome and asthma. J Allergy, 2013, 2013: 340476. [Crossref]
13. Parakatselaki M, & Ladoukakis E. mtDNA heteroplasmy: origin, detection, significance, and evolutionary consequences. Life, 2021, 11(7): 633-646. [Crossref]
14. Just R, Irwin J, & Parson W. Mitochondrial DNA heteroplasmy in the emerging field of massively parallel sequencing. Forensic Sci Int Genet, 2015, 18: 131-139. [Crossref]
15. Smullen M, Olson M, Murray L, Suresh M, Yan G, Dawes P, et al. Modeling of mitochondrial genetic polymorphisms reveals induction of heteroplasmy by pleiotropic disease locus 10398A>G. Sci Rep, 2023, 13(1): 10405. [Crossref]
16. Zhou H, Nie K, Qiu R, Xiong J, Shao X, Wang B, et al. Generation and bioenergetic profiles of cybrids with east Asian mtDNA haplogroups. Oxid Med Cell Longev, 2017, 2017(1): 1062314. [Crossref]
17. Juo S, Lu M, Bai R, Liao Y, Trieu R, Yu M, et al. A common mitochondrial polymorphism 10398A>G is associated metabolic syndrome in a Chinese population. Mitochondrion, 2010, 10(3): 294-299. [Crossref]
18. Mareckova K, Mendes-Silva A, Jáni M, Pacinkova A, Piler P, Gonçalves V, et al. Mitochondrial DNA variants and their impact on epigenetic and biological aging in young adulthood. Transl Psychiatry, 2025, 15(1): 16-28. [Crossref]
19. D'Souza R, Woodhead J, Hedges C, Zeng N, Wan J, Kumagai H, et al. Increased expression of the mitochondrial derived peptide, MOTS-c, in skeletal muscle of healthy aging men is associated with myofiber composition. Aging, 2020, 12(6): 5244-5258. [Crossref]
20. Zempo H, Kim S, Fuku N, Nishida Y, Higaki Y, Wan J, et al. A pro-diabetogenic mtDNA polymorphism in the mitochondrial-derived peptide, MOTS-c. Aging, 2021, 13(2): 1692-1717. [Crossref]
21. Lalrohlui F, Zohmingthanga J, Hruaii V, & Kumar N. Genomic profiling of mitochondrial DNA reveals novel complex gene mutations in familial type 2 diabetes mellitus individuals from Mizo ethnic population, Northeast India. Mitochondrion, 2020, 51: 7-14. [Crossref]
22. Sharma V, Sharma I, Singh V, Verma S, Pandita A, Singh V, et al. mtDNA G10398A variation provides risk to type 2 diabetes in population group from the Jammu region of India. Meta Gene, 2014, 2: 269-273. [Crossref]
23. Liao W, Pang Y, Yu C, Wen J, Zhang Y, & Li X. Novel mutations of mitochondrial DNA associated with type 2 diabetes in Chinese Han population. Tohoku J Exp Med, 2008, 215(4): 377-384. [Crossref]
24. Pipal K, Mamtani M, Patel A, Jaiswal S, Jaisinghani M, & Kulkarni H. Susceptibility loci for type 2 diabetes in the ethnically endogamous Indian Sindhi population: a pooled blood genome-wide association study. Genes, 2022, 13(8): 1298-1309. [Crossref]
25. Basu A, Sarkar-Roy N, & Majumder P. Genomic reconstruction of the history of extant populations of India reveals five distinct ancestral components and a complex structure. Proc Natl Acad Sci USA, 2016, 113(6): 1594-1599. [Crossref]