Open Access | Research Article
This work is licensed under a Creative Commons Attribution-ShareAlike 4.0 International License.
Thioredoxin overexpression in mitochondria showed minimum effects on aging and age-related diseases in male C57BL/6 mice
* Corresponding author: Yuji Ikeno, M.D., Ph.D.
Mailing address: Barshop Institute for Longevity and Aging
Studies, The University of Texas Health Science Center at San
Antonio, 15355 Lambda Drive, San Antonio, TX 78245-3207,
USA.
E-mail: ikeno@uthscsa.edu
Received: 26 February 2020 / Accepted: 17 March 2020
DOI: 10.31491/APT.2020.03.009
Abstract
Objective: In this study, the effects of overexpression of thioredoxin 2 (Trx2) on aging and age-related diseases
were examined using Trx2 transgenic mice [Tg(TXN2)+/0]. Because our previous studies demonstrated that
thioredoxin (Trx) overexpression in the cytosol (Trx1) did not extend maximum lifespan, this study was conducted to test if increased Trx2 expression in mitochondria shows beneficial effects on aging and age-related
pathology.
Methods: Trx2 transgenic mice were generated using a fragment of the human genome containing the TXN2
gene. Effects of Trx2 overexpression on survival, age-related pathology, oxidative stress, and redox-sensitive
signaling pathways were examined in male Tg(TXN2)+/0 mice.
Results: Trx2 levels were significantly higher (approximately 1.6- to 5-fold) in all of the tissues we examined in
Tg(TXN2)+/0 mice compared to wild-type (WT) littermates, and the expression levels were maintained during
aging (up to 22-24 months old). Trx2 overexpression did not alter the levels of Trx1, glutaredoxin, glutathione,
or other major antioxidant enzymes. Overexpression of Trx2 was associated with reduced reactive oxygen species (ROS) production from mitochondria and lower isoprostane levels compared to WT mice. When we conducted the survival study, male Tg(TXN2)+/0 mice showed a slight extension (approximately 8-9%) of mean, median, and 10th percentile lifespans; however, the survival curve was not significantly different from WT mice.
Cross-sectional pathological analysis (22-24 months old) showed that Tg(TXN2)+/0 mice had a slightly higher
severity of lymphoma; however, tumor burden, disease burden, and severity of glomerulonephritis and inflammation were similar to WT mice. Trx2 overexpression was also associated with higher c-Jun and c-Fos levels;
however, mTOR activity and levels of NFκB p65 and p50 were similar to WT littermates.
Conclusions: Our findings suggest that the increased levels of Trx2 in mitochondria over the lifespan in
Tg(TXN2)+/0 mice showed a slight life-extending effect, reduced ROS production from mitochondria and oxidative damage to lipids, but showed no significant effects on aging and age-related diseases.
Keywords
Thioredoxin, transgenic Mouse, oxidative stress, aging
Introduction
Thioredoxin (Trx) has drawn much interest in biology, including aging, because of its unique ability to attenuate the level of oxidative stress/damage and alter redoxsensitive signaling, which could have diverse effects on pathophysiology. Trx is a small protein (12kDa) with two redox-active cysteine residues in the active center (CysGly-Pro-Cys) [1] and acts as the reductant for a variety of enzymes [1-7]. Trx also plays an important role in maintaining a reduced environment in cells through thioldisulfide exchange reactions [1]. This rapid and readily reversible reaction is ideal for protein function control via the redox state of structural or catalytic SH groups. In humans, Trx1 and Trx2 have been identified in different compartments of the cell, i.e., Trx1 in cytosol [8] and Trx2 in mitochondria [9]. To test the pathophysiological roles of Trx1 during aging, two transgenic mice overexpressing Trx1 were generated using: 1) a transgene containing the human thioredoxin cDNA fused to the β–actin promoter [Tg(act-TXN)+/0 mice] [10] and 2) clones of the human TXN gene containing endogenous promoters [Tg(TXN)+/0] [11]. The initial aging study demonstrated that Tg(act-TXN)+/0 mice had an increased lifespan compared to their WT littermates [10,12]. However, the lifespan of WT C57BL/6 mice in their colony was shorter than WT C57BL/6 mice in aging colonies under optimal conditions, which indicates that the study was conducted under unconventional housing conditions. Therefore, an aging study with the same line of Tg(act-TXN)+/0 mice under optimal housing conditions was conducted by our laboratory to examine the effects of increased levels of Trx1 on aging and age-related diseases. Under optimal housing conditions, male and female Tg(act-TXN)+/0 mice showed an extension of lifespan only in the earlier part of their lifespan; however, no increase in maximum lifespan was observed [13]. Because Tg(actTXN)+/0 mice showed that the levels of overexpression significantly decreased with age possibly due to the β-actin promoter, we subsequently generated new transgenic mice with clones of the human TXN gene containing endogenous promoters [Tg(TXN)+/0] to ensure that the transgene would be overexpressed throughout the lifespan [11]. The aging study with Tg(TXN)+/0 mice demonstrated that continuous overexpression of Trx1 over the lifespan slightly extended the earlier part of life, but had no significant effects on median or maximum lifespans. Tg(TXN)+/0 mice also showed that Trx1 overexpression accelerates cancer development in old mice [11], which is similar to the pathology results in Tg(act-TXN)+/0 mice [13]. The results from two lines of Trx1 transgenic mice showed that overexpression of Trx1 in cytosol does not have beneficial effects in aged mice, i.e., no life-extending effects with enhanced tumor development in the later part of life. These results led us to question whether increased levels of Trx2 in mitochondria could play more important roles in aging, i.e., extend both the earlier and later part of lifespan and attenuate the development of age-related diseases. The study with mCAT mice [14] clearly demonstrated the importance of antioxidant overexpression in mitochondria in aging. In their study, overexpressing catalase in mitochondria significantly increased lifespan and reduced some types of cancers, while overexpressing catalase in other compartments of the cells (nucleus or peroxisome) did not change lifespan [14]. Thus, the purpose of this study is to examine the effects of Trx2 overexpression in the mitochondria on aging. We conducted a survival study using transgenic mice generated with a clone of the human TXN2 gene containing an endogenous promoter [Tg(TXN2)+/0]. Here, we report that increased levels of Trx in mitochondria [Tg(TXN2)+/0 mice] showed no significant changes in lifespan compared to WT mice, although a slight extension (approximately 8-9%) of mean, median, and 10th percentile lifespans (not statistically significant) was observed. Tg(TXN2)+/0 mice also showed no significant effects on age-related pathological changes. Therefore, our results suggest that the overexpression of Trx2 has minimal effects on aging and development of age-related diseases in male C57BL/6 mice.
Materials and Methods
Animals and animal husbandry
We generated the Tg(TXN2)+/0 mice using the human
thioredoxin 2 gene [a PAC clone (RP5-1119A7), Children’s Hospital Oakland Research Institute’s (CHORI)
BACPAC Resources Center (BPRC), Oakland, CA],
which contained the TXN2 gene and 13.7 kb and 6.6 kb
of the 5’- and 3’-flanking sequences, respectively (Figure
1). These transgenic mice were produced by pronuclear
microinjection of zygotes obtained from the mating of
(C57BL/6J X SJL/J)F1 females with (C57BL/6J X SJL/
J)F1 males (Jackson Laboratory, stock no. 100012) and
were backcrossed to C57BL/6 mice ten times. Male hemizygous transgenic mice [Tg(TXN2)+/0] were crossed with
C57BL/6 females to generate hemizygous transgenic
and WT control mice. All mice were fed a commercial
chow (Teklad Diet LM485: Madison, WI) and acidified
(pH=2.6-2.7) filtered reverse osmosis water ad libitum. To
measure the amount of food consumption, the amount of
chow removed from the cage hopper and the spillage (the
chow on the bottom of the cage) were weighed monthly.
Actual food consumed was calculated by subtracting
the spillage from the chow removed from the hopper.
All of the mice were weighed monthly. The mice were
maintained pathogen-free in microisolator units on Tek
FRESH ultra laboratory bedding. Sentinel mice housed in
the same room and exposed weekly to bedding collected
from the cages of experimental mice were sacrificed on
receipt and every six months thereafter for monitoring of
viral antibodies (Mouse Level II Complete Antibody Profile CARB, Ectro, EDIM, GDVII, LCM, M. Ad-FL, M.
Ad-K87, MCMV, MHV, M. pul., MPV, MVM, Polyoma,
PVM, Reo, Sendai; BioReliance, Rockville, MD). All
tests were negative.
We chose young (4-6 months old) and old (22-24 months
old) age groups for the experiments described below because: 1) C57BL/6 mice reach their optimum reproductivity at 3-7 months of age and 2) have increased incidence of cancers after 20 months of age followed by advanced
stages of cancer around 26-30 months of age. For some
of the assays, only liver was used because there is a large
amount of information available with respect to agerelated changes, and liver is one of the major sites for the
development of spontaneous tumors in C57BL/6 mice.
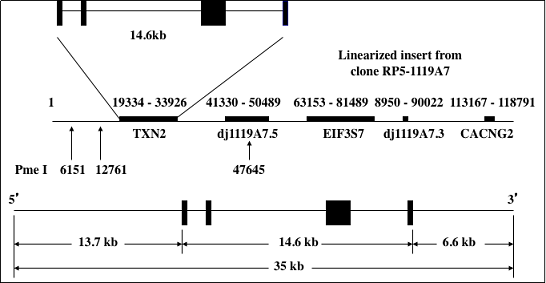
Figure 1. DNA construct for Tg(TXN2)+/0 mice. The human thioredoxin 2 gene (TXN2) with 13.7 kb and 6.6 kb of the 5’- and 3’-flanking sequences was used to generate Tg(TXN2)+/0 mice by pronuclear microinjection of zygotes from the mating of (C57BL/6J X SJL/J)F1 females with (C57BL/6J X SJL/J)F1 males.
PD rat model
The expressions of miR-152, MKK7 mRNA, and MKK7 mRNA in cells were detected using quantitative real-time PCR (qRT-PCR). Total RNAs were extracted from the tumor tissues and cells using Trizol reagent (Invitrogen, Waltham, MA, US). The TaqMan Reverse Transcription Kit (Applied Biosystems, Foster City, CA, US) was used to reversely transcribe RNAs into cDNAs. The qRT-PCR was conducted using the SYBR Premix Ex TaqTM II Kit (Takara, Dalian, Liaoning, China) on an ABI 7500 RealTime PCR system (Applied Biosystems, Waltham, MA, US). U6 was used as the internal control for miR-152, and GAPDH was used as the internal control for mRNAs. The relative expressions were calculated using the 2−ΔΔCt method.
Determination of Trx2 expression
Thioredoxin 2 (Trx2) levels were measured using the mitochondrial fraction obtained from several tissues (liver, kidney, heart, brain, lung, spleen, and testes) from young (4-6 months old) and liver from old (22-24 months old) Tg(TXN2)+/0 and WT mice as previously described [13,15]. Western blot analysis was performed using rabbit anti-Trx2 polyclonal antibody (Catalog No. LF-PA0012; LabFrontier, Seoul, South Korea). After incubation with the primary antibodies, membranes were incubated with the respective peroxidase-linked secondary antibodies (Catalog No. P0217; Dako, Carpinteria, CA). Chemiluminescence was detected using the ECL Western blot detection kit (Amersham Biosciences Corp., Piscataway, NJ).
Trx1 levels
Cytosolic fractions obtained from tissues homogenized as previously described [13] were used to determine Trx1 levels in liver obtained from young (4-6 months old) Tg(TXN2)+/0 and WT mice by Western blot analysis using goat anti-human Trx1 polyclonal antibodies (Catalog No. 705; American Diagnostica, Inc., Greenwich, CT). These antibodies recognize total Trx1 (both oxidized and reduced forms). After incubation with the primary antibody, membranes were incubated with the peroxidase-linked secondary antibody (Catalog No. P0449; Dako, Carpinteria, CA). Chemiluminescence was detected with an ECL Western blot detection kit (Amersham Biosciences Corp., Piscataway, NJ).
Glutaredoxin and total glutathione levels
Glutaredoxin (Grx) levels were measured using total homogenate fractions obtained from the liver of young (4-6 months old) Tg(TXN2)+/0 and WT mice as previously described [13]. Western blot analysis was performed using goat anti-human glutaredoxin polyclonal antibody (Catalog No. 710; American Diagnostica, Inc., Greenwich, CT). After incubation with the primary antibodies, membranes were incubated with the respective peroxidase-linked secondary antibodies (Catalog No. P0449; Dako, Carpinteria, CA). Chemiluminescence was detected using the ECL Western blot detection kit (Amersham Biosciences Corp., Piscataway, NJ). The levels of total glutathione were determined using the Bioxytech GSH-420 kit (Catalog No. 21023; Oxis International, Inc., Foster City, CA) in several tissues (liver, kidney, heart, brain, lung, spleen, and testes) from young (4-6 months old) Tg(TXN2)+/0 and WT mice.
Determination of major antioxidant enzyme activities: Cu/ZnSOD, MnSOD, glutathione peroxidase, and catalase
The activities of major antioxidant enzymes (Cu/ZnSOD, MnSOD, glutathione peroxidase (GPx), and catalase) were measured in tissue homogenates obtained from the liver of young (4-6 months old) Tg(TXN2)+/0 and WT mice. The supernatants were used for the antioxidant defense enzymatic activity assay. GPx activity in tissue homogenates was measured by the assay described by Sun et al. [16]. Catalase activity was determined by measuring the decomposition of hydrogen peroxide at 520 nm using the Catalase-520TM assay kit (OxisResearchTM, Portland, OR). MnSOD and Cu/ZnSOD levels were measured by activity gels as previously described [17,18]. Images of the gels were analyzed by ImageQuant software.
Reactive oxygen species (ROS) production from mitochondria
H2O2 release from isolated mitochondria obtained from skeletal muscle was measured using the fluorogenic probe, Amplex Red (Molecular Probes, Eugene, OR) as previously described [19].
Assays for lipid peroxidation(F2-isoprostane levels)
The levels of F2-isoprostanes were determined using gas chromatography/mass spectrometry as described by Morrow and Roberts [20]. The plasma samples obtained from young (4-6 months old) Tg(TXN2)+/0 and WT mice were added to HPLC (pH 3.0) water and mixed by vortex. After centrifugation (2,500 x g for 3 minutes at 4°C), the F2- isoprostanes were extracted from the clear supernatants with a C18 Sep-Pak column and a silica Sep-Pak column. The F2-isoprostanes were then converted to pentafluorobenzyl esters and subjected to thin layer chromatography. The F2-isoprostanes were further converted to trimethylsilyl ether derivatives, and the F2-isoprostane levels were quantified by gas chromatography/mass spectrometry. An internal standard, 8-isoPGF2a-d4 (Cayman Chemical, Ann Arbor, MI), was added to the samples at the beginning of extraction to correct the yield of the extraction process. The amounts of F2-isoprostanes were expressed as picograms of 8-Iso-prostaglandin F2 per milliliter of plasma sample.
Assays for DNA oxidation (8-oxodG levels)
The levels of oxidative damage to DNA were measured by the amount of 8-oxo-2-deoxyguanosine (oxo8dG) in DNA as described by Hamilton et al. [21]. DNA was isolated from liver obtained from young (4-6 months old) Tg(TXN2)+/0 and WT mice by NaI extraction using the DNA Extractor WB Kit (Wako Chemicals USA, Inc., Richmond, VA). The data are expressed as the ratio of nmoles of oxo8dG to 105 nmoles of 2dG.
Survival study
Mice in the survival groups were allowed to live out their lives, and the lifespan for individual mice was determined by recording the age of spontaneous death. A survival study consisting of 19 Tg(TXN2)+/0 and 22 WT male mice was conducted. The survival curves were compared statistically using the log-rank test [22]. The mean, median, and 10th percentile (when 90% of the mice had died) survival were calculated for each group. The mean survivals for each experimental group were compared to the respective WT group by performing a Student’s t-test upon log-transformed survival times. The median and 10th percentile survivals for each group were compared to the WT group using a score test adapted from Wang et al. [23].
Cross–sectional pathological assessment
The cross-sectional pathological analyses were conducted with 23 Tg(TXN2)+/0 mice and 19 WT male mice. After the gross pathological examinations, the following organs and tissues were excised and preserved in 10% buffered formalin: brain, pituitary gland, heart, lung, trachea, thymus, aorta, esophagus, stomach, small intestine, colon, liver, pancreas, spleen, kidneys, urinary bladder, reproductive system (prostate, testes, epididymis, and seminal vesicles), thyroid gland, adrenal glands, parathyroid glands, psoas muscle, knee joint, sternum, and vertebrae. Any other tissues with gross lesions were also excised. The fixed tissues were processed conventionally, embedded in paraffin, sectioned at 5 m, and stained with hematoxylineosin. The diagnosis of each histopathological change was made with histological classifications in aging mice as previously described [24,25]. A list of pathological lesions was constructed for each mouse that included both neoplastic and non-neoplastic diseases. Based on these histopathological data, the tumor burden, disease burden, and severity of each lesion in each mouse were assessed as previously described [25-27].
Determination of c-Jun and c-Fos levels
Total cell lysates from liver of young (4-6 months old) Tg(TXN2)+/0 and WT mice were prepared, and detection of c-Jun (Catalog No. 9165; Cell Signaling Technology, Inc., Danvers, MA) and c-Fos (Catalog No. 4384; Cell Signaling Technology, Inc., Danvers, MA) were performed using Western blots. The amount of c-Jun and cFos was quantified by a densitometer, and the data were expressed as the relative amount of protein in lysates using β-actin as an internal standard.
Determination of mTOR signaling pathway activity and HIF-1α levels
Levels of p70S6K1 and 4E-BP1 (phosphorylated and nonphosphorylated forms) were measured in the total cell
lysates from liver of young (4-6 months old) Tg(TXN2)+/0 and WT mice by Western blot analysis using mouse
p70S6K1, phospho-p70S6K1, 4E-BP1, and phospho-4EBP1 antibodies (Cell Signaling Technology, Inc., Danvers,
MA).
Total cell lysates from liver of young (4-6 months old)
Tg(TXN2)+/0 and WT mice were prepared, and detection
of p70S6K1 and 4E-BP1 (phosphorylated and non-phosphorylated forms) was performed using Western blots.
The amount of p70S6K1 and 4E-BP1 (phosphorylated and
non-phosphorylated forms) was quantified by a densitometer, and the data were expressed as the relative amount of
protein in lysates using β-actin as an internal standard.
Total cell lysates from liver of young (4-6 months old)
Tg(TXN2)+/0 and WT mice were prepared, and detection
of HIF-1α (Catalog No. Ab82832; Abcam, Cambridge,
MA) was performed using Western blots. The amount of
HIF-1α was quantified by a densitometer, and the data
were expressed as the relative amount of protein in lysates
using β-actin as an internal standard.
Measurement of the NFκB pathway
The levels of NFκB (p65 and p50) were measured in the total cell lysates from liver of young (4-6 months old) Tg(TXN2)+/0 and WT mice by Western blot analysis using mouse NFκB p65 (Catalog No. 3034; Cell Signaling Technology, Inc., Danvers, MA) and p50 (Catalog No. 3035; Cell Signaling Technology, Inc., Danvers, MA) antibodies.
Statistical analysis
Unless otherwise specified, all experiments were done at least in triplicate. Data were expressed as means ± SEM and were analyzed by the non-parametric test ANOVA. All pair-wise contrasts were computed using Tukey error protection at 95% CI, unless otherwise indicated. Differences were considered statistically significant at p<0.05.
Results
Overexpression of Trx2 in tissues from Tg(TXN2)+/0 mice
The levels of Trx2 in tissues (liver, kidney, heart, brain, lung, spleen, and testes) from young (4-6 months old) Tg(TXN2)+/0 and WT mice were measured using Western blot analysis. The Trx2 protein levels were significantly higher (approximately 1.6- to 5-fold) in all of the seven tissues examined in young Tg(TXN2)+/0 mice compared to their WT littermates (Figure 2a; p< 0.05). The levels of Trx2 overexpression were maintained in the liver of old (22-24 months old) Tg(TXN2)+/0 mice (Figure 2b; p< 0.05).
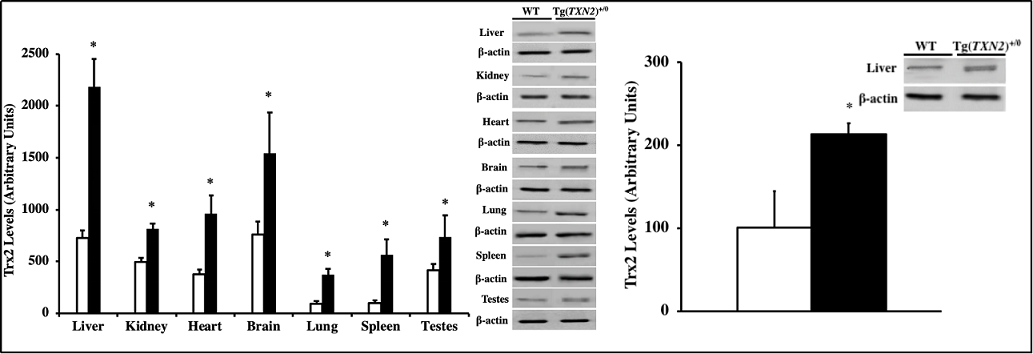
Figure 2. Overexpression of Trx2 in young and old Tg(TXN2)+/0 mice and their WT littermates. The levels of Trx2 protein were determined by Western blot in various tissues of 4-6 months old(Figure 2a: left) and in the liver of 22-24 months old(Figure 2b: right) Tg(TXN2)+/0 (closed bar) and WT (open bar) mice. Trx2 levels were significantly higher in both young and old Tg(TXN2)+/0 mice compared to their WT littermates (*p< 0.05). The data are the mean SEM from three to five mice.
Levels of Trx1, glutaredoxin, total glutathione, and major antioxidant enzymes in tissues from Tg(TXN2)+/0 mice
To examine whether the increased levels of Trx2 altered the levels of Trx1, glutaredoxin, and glutathione, which
have biological functions similar to Trx2, we measured
the levels of Trx1, glutaredoxin, and total glutathione in
liver and other tissues obtained from young (4-6 months
old) Tg(TXN2)+/0 and WT mice. The data in Figure 3
show that Trx1 (Figure 3a) and glutaredoxin (Figure 3b) levels in the liver were similar between Tg(TXN2)+/0 and
WT mice at 4-6 months of age (p> 0.05). The levels of
total glutathione in the tissues (liver, kidney, heart, brain,
lung, spleen, and testes) were also similar between young
(4-6 months old) Tg(TXN2)+/0 and WT mice (Figure 3c;
p> 0.05).
The activities of major antioxidant enzymes (Cu/ZnSOD,
MnSOD, glutathione peroxidase (GPx), and catalase) were
similar between young (4-6 months old) Tg(TXN2)+/0 and
WT mice (data not shown).
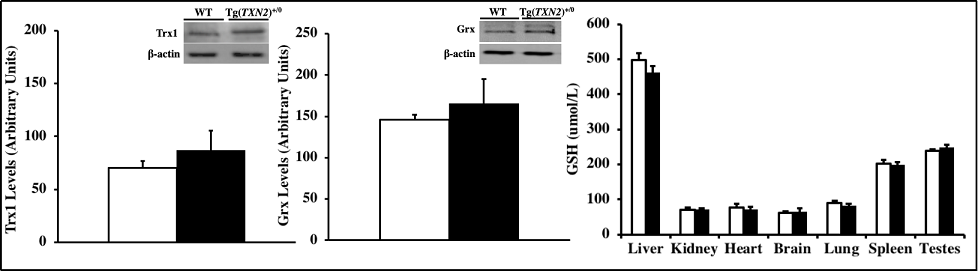
Figure 3. Levels of Trx1, glutaredoxin, and total glutathione in Tg(TXN2)+/0 and WT mice. The levels of Trx1 (Figure 3a: left), glutaredoxin (Figure 3b: center), and total glutathione (Figure 3c: right) were measured in the liver of 4-6 months old Tg(TXN2)+/0 (closed bar) and WT mice (open bar). No significant difference was observed in Trx1, glutaredoxin, or total glutathione in Tg(TXN2)+/0 mice compared to WT mice. The data in figures 3a-3c are the mean SEM from three to five mice.
Hydrogen peroxide production from mitochondria
H2O2 release from isolated mitochondria obtained from skeletal muscle was measured using the fluorogenic probe, Amplex Red (Molecular Probes, Eugene, OR) as previously described [19]. The H2O2 release from isolated mitochondria from skeletal muscle was significantly less in both young (4-6 months old) and old (22-24 months old) Tg(TXN2)+/0 mice compared to their WT littermates (Figures 4a and 4b; p< 0.05).
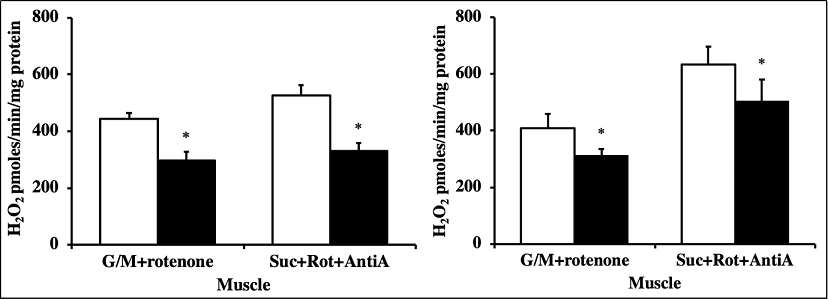
Figure 4. Hydrogen peroxide production in young and old Tg(TXN2)+/0 and WT mice. The Amplex Red assay was performed in the skeletal muscle of 4-6 months (Figure 4a: left) and 22-24 months old (Figure 4b: right) Tg(TXN2)+/0 (closed bar) and WT (open bar) mice. Under different experimental conditions, H2O2 production was significantly less in mitochondria from both young and old Tg(TXN2)+/0 mice compared to WT mice (*p< 0.05). The values are the mean ± SEM of five mice per group.
Lipid peroxidation (F2-isoprostane levels) and DNA oxidation (8-oxodG levels)
We tested whether Trx2 overexpression protects against oxidative damage by measuring levels of lipid peroxidation (F2 isoprostanes) in serum and DNA oxidation (8-oxodG) in liver from young (4-6 months old) Tg(TXN2)+/0 and WT mice. Levels of F2-isoprostanes were significantly lower in young (4-6 months old) Tg(TXN2)+/0 mice compared to WT mice (Figure 5a; p< 0.05), however, Tg(TXN2)+/0 mice had only 13-14% lower levels of F2-isoprostanes compared to WT mice, in spite of the significant ROS production from mitochondria (Figures 4a and 4b). Although Trx2 overexpression reduced the ROS production from mitochondria and oxidative damage to lipids, levels of DNA oxidation measured by 8-oxodG were similar between young (4-6 months old) Tg(TXN2)+/0 and WT mice (Figure 5b; p> 0.05).
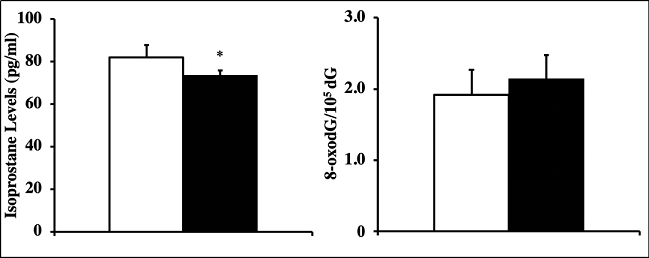
Figure 5. Levels of F2-isoprostanes and DNA oxidation in Tg(TXN2)+/0 and WT mice. F2-isoprostanes levels were measured in plasma samples from 4-6 months old (Figure 5a: left) and DNA oxidation (8-oxodG) in liver from 4-6 months old (Figure 5b: right) Tg(TXN2)+/0 (closed bar) and WT (open bar) mice. The F2-isoprostane levels were significantly lower in Tg(TXN2)+/0 mice than in WT control mice (*p< 0.05). Levels of DNA oxidation in the livers of Tg(TXN2)+/0 and WT mice showed no significant difference. The data are the mean SEM from five mice.
Survival curves, body and organ weights
The survival curves of Tg(TXN2)+/0 and WT mice are presented in Figure 6. The survival study was conducted with 19 Tg(TXN2)+/0 and 22 WT male mice. The survival curves were not significantly different between Tg(TXN2)+/0 and WT mice (Log-rank: p> 0.05). The mean, median, and 10th percentile survival for WT mice were 852, 833, and 1,094 days, respectively (Figure 6). The mean, median, and 10th percentile survival for Tg(TXN2)+/0 mice were 922, 907, and 1,183 days, respectively (Figure 6). Tg(TXN2)+/0 mice had slightly longer mean (8.2%), median (8.9%), and 10th percentile (8.1%) lifespans compared to WT mice, however, these differences did not reach statistical significance (p> 0.05).
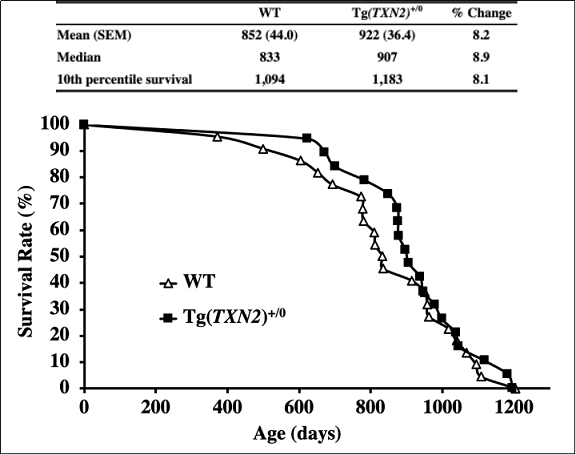
Figure 6. The survival curves of Tg(TXN2)+/0 and WT mice. The survival curves, mean, median, and 10th percentile lifespans (days), and percent differences of Tg(TXN2)+/0 (closed squares) and WT (open triangles) mice are presented. The cohort consists of 19 Tg(TXN2)+/0 and 22 WT male mice. The survival curves did not show a significant difference between Tg(TXN2)+/0 and WT mice (p> 0.05). Tg(TXN2)+/0 mice had a slightly longer mean (8.2%), median (8.9%), and 10th percentile (8.1%) lifespans compared to WT mice, which were not statistically significant (p> 0.05).
The body and organ weights were similar between Tg(TXN2)+/0 and WT mice (Table 1). Food consumption was also similar between Tg(TXN2)+/0 and WT mice (data not shown).
Table1
Body and organ weights of Tg(TXN2)+/0 young mice .
| WT(n=6) | Tg(TXN2)+/0(n=6) | |
|---|---|---|
| Body Weight (g) | 30.711± 1.222 | 29.198 ± 2.138 |
| Liver (g) | 1.847 ± 0.146 | 1.688 ± 0.126 |
| Spleen (g) | 0.100 ± 0.007 | 0.132 ± 0.026 |
| Pancreas (g) | 0.185 ± 0.012 | 0.185 ± 0.024 |
| Heart (g) | 0.177 ± 0.006 | 0.187 ± 0.015 |
| Lung (g) | 0.207 ± 0.006 | 0.197 ± 0.010 |
| Left Kidney (g) | 0.272 ± 0.009 | 0.256 ± 0.031 |
| Right Kidney (g) | 0.302 ± 0.018 | 0.301 ± 0.020 |
| Left Testis (g) | 0.115 ± 0.004 | 0.120 ± 0.005 |
| Right Testis (g) | 0.118 ± 0.005 | 0.126 ± 0.005 |
| Brain (g) | 0.408 ± 0.012 | 0.412 ± 0.008 |
Cross-sectional pathology
The cross-sectional pathological analyses of 23
Tg(TXN)+/0 and 19 WT mice (22-24 months old) showed
that the major disease in these mice was neoplastic disease. The tumors observed were lymphoma, hemangioma/
hemangiosarcoma in the liver and spleen, pulmonary adenocarcinoma, hepatocellular carcinoma, and adenoma in
the thyroid gland, and the most prevalent tumor was lymphoma, which is consistent with the pathology data from
C57BL/6 mice and mice overexpressing Trx1 [11,13].
First, we compared the number of different types of tumors (tumor burden) for each mouse in both Tg(TXN2)+/0 and WT groups because aging mice may have several different types of tumors. As the data in Figure 7a show, the
tumor burden for the Tg(TXN2)+/0 mice is similar to WT
mice (p > 0.05). The incidence of lymphoma was similar
between Tg(TXN2)+/0 and WT mice (data not shown).
Tg(TXN2)+/0 mice had a slightly higher severity of lymphoma than WT mice, which was not statistically significant (Figure 7b; p> 0.05).
Next, we compared the severity of major non-neoplastic
disease between the two groups. Severity of glomerulonephritis and inflammation, which were the most common
non-neoplastic lesions observed in these mice, were compared between Tg(TXN2)+/0 and WT mice. No significant
changes were found regarding the severity of glomerulonephritis or inflammation in Tg(TXN2)+/0 and WT mice
(data not shown). The disease burden, defined as the total
number of histopathological changes in a body, which can
also serve as a good index of age-related accumulation
of tissue and cell injury [24,26,27], were similar between
Tg(TXN2)+/0 and WT mice (data not shown).
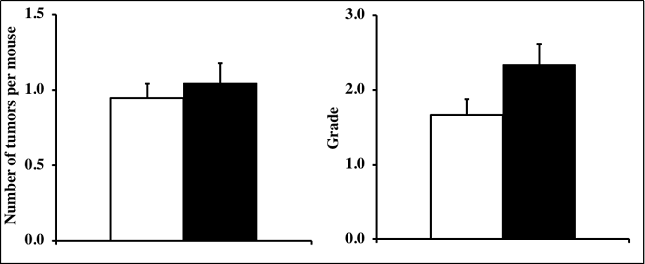
Figure 7. Tumor burden and severity of lymphoma in Tg(TXN2)+/0 and WT mice. The number of different types of tumors, tumor burden (Figure 7a: left) and the severity of lymphoma (Figure 7b: right) in Tg(TXN2)+/0 (closed bar) and WT (open bar) mice were compared at 22- 24 months old. The cohort consists of 23 Tg(TXN2)+/0 and 19 WT male mice. The tumor burden for the Tg(TXN2)+/0 mice is similar to WT mice and the severity of lymphoma is slightly higher in Tg(TXN2)+/0 mice compared to their WT littermates, which were not statistically significant (p> 0.05).
Measurement of the c-Fos and c-Jun levels
Since c-Fos and c-Jun are redox-sensitive transcription factors, and their levels are correlated to cancer development, the levels of c-Fos and c-Jun were measured using Western blot. The data in Figure 8 show that Tg(TXN2)+/0 mice had significantly higher levels of c-Fos and c-Jun compared to their WT littermates (Figures 8a and 8b, respectively; p< 0.05).
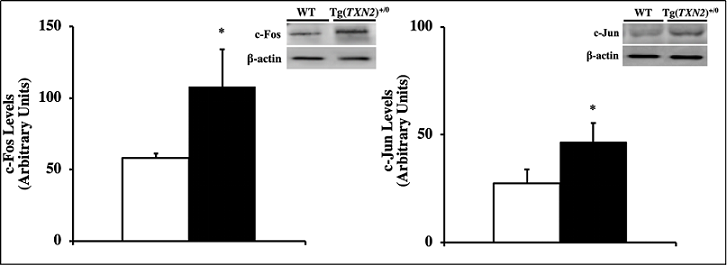
Figure 8. Levels of c-Fos and c-Jun in Tg(TXN2)+/0 and WT mice. The levels of c-Fos (Figure 8a: left) and c-Jun (Figure 8b: right) were measured in the liver of 4-6 months old Tg(TXN2)+/0 (closed bar) and WT mice (open bar) by Western blot. The cFos and c-Jun levels were significantly higher in Tg(TXN2)+/0 mice than in WT control mice (*p< 0.05). The data are the mean SEM from three to five mice.
Determination of mTOR signaling pathway activity and HIF-1α levels
Since substantial evidence showed that mTOR activity is one of the key pathways for cancer development and lifespan, levels of p70S6K1 and 4E-BP1 (phosphorylated and non-phosphorylated forms) were measured in the total cell lysates from liver of Tg(TXN2)+/0 and WT mice by Western blot analysis using mouse p70S6K1, phosphop70S6K1, 4E-BP1, and phospho-4E-BP1 antibodies. The data in Figure 9a show that Tg(TXN2)+/0 mice had slightly higher levels of phospho-p70S6K1 compared to WT littermates, although the difference was not statistically significant (Figure 9a; p> 0.05). Levels of phospho-4E-BP1 were similar between Tg(TXN2)+/0 and WT mice (Figure 9b; p> 0.05). In addition, the levels of HIF-1α, which also plays important roles in cancer development, were similar between Tg(TXN2)+/0 and WT littermates (data not shown).
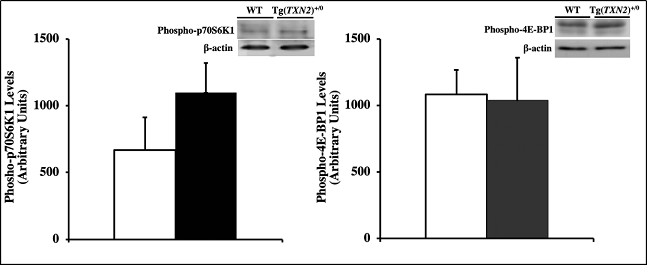
Figure 9. Levels of mTOR in Tg(TXN2)+/0 and WT mice. The levels of phospho-p70S6K1 (Figure 9a: left) and phospho-4E-BP1 (Figure 9b: right) were measured in the liver of young (4-6 months old) Tg(TXN2)+/0 (closed bar) and WT (open bar) mice by Western blot analysis. The levels of phospho-p70S6K1 and phospho-4E-BP1 were similar between Tg(TXN2)+/0 and WT mice (p> 0.05). The data are the mean SEM from three to five mice.
Measurement of the NFκB pathway
Since NFκB is one of the redox-sensitive transcription factors, which plays important roles in oxidative stress, inflammation, apoptosis, and cancer, the levels of NFκB (p65 and p50) were measured using Western blot. The data in Figure 10 show that Tg(TXN2)+/0 mice had similar levels of NFκB p65 and NFκB p50 compared to their WT littermates (Figures 10a and 10b, respectively; p> 0.05).
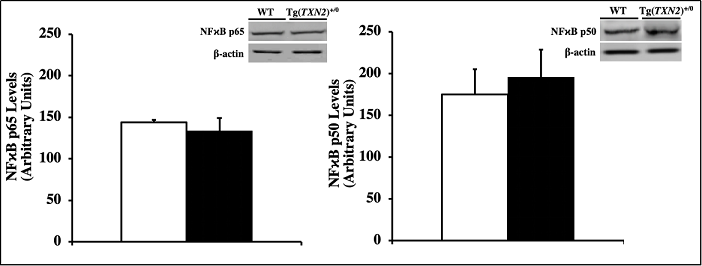
Figure 10. Levels of NFκB p65 and NFκB p50 in Tg(TXN2)+/0 and WT mice. The levels of NFκB p65 (Figure 10a: left) and NFκB p50 (Figure 10b: right) were measured in the liver of young (4-6 months old) Tg(TXN2)+/0 (closed bar) and WT (open bar) mice. The levels of NFκB p65 and NFκB p50 were similar between Tg(TXN2)+/0 and WT mice (p> 0.05). The data are the mean SEM from three to five mice.
Discussion
After the initial discovery as the major reductant for a
variety of enzymes in the early 1960s, unique biological
roles of thioredoxin (Trx) have been well documented [1]. Trx plays important roles as a hydrogen donor to
enzymes involved in reductive reactions [e.g., ribonucleotide reductase, which reduces ribonucleotides to deoxyribonucleotides for DNA synthesis; peroxiredoxin (Prx),which reduces peroxides [4-6]and methionine sulfoxide
(MetO) reductase, which reduces MetO in proteins and
provides protection against oxidative stress [2,3,7]. Trx
also plays important roles to protect cells and tissues from
oxidative stress by maintaining a reduced environment in
cells through thiol-disulfide exchange reactions [10,28-
30]. Trx has two forms in human cells: one in cytosolic
(hTrx1) [8] and another in mitochondrial (hTrx2) [9]. Essential roles of Trx1 and Trx2 in mammals were further
proven by the studies with knockout mice null for either
Trx1 or Trx2, which are embryonically lethal [31,32]. Although the important roles of Trx along with thioredoxin
interacting protein (Txnip) in pathophysiology have been
well documented [1,33], the exact roles of Trx on aging
and age-related pathology in mammals had been largely
unknown.
To test the role of Trx in aging, a lifespan study was first
conducted using the mice overexpressing Trx1 generated
with a transgene containing the human thioredoxin cDNA
fused to the β-actin promoter [Tg(act-TXN)+/0 mice] [10,12]. The study demonstrated that Trx1 overexpression resulted in an increased lifespan compared to their
WT littermates [10,12]. However, there were shortcomings in the study; the survival study was conducted under conventional housing conditions and the lifespan of
WT C57BL/6 mice in their colony was shorter than WT
C57BL/6 mice in aging colonies under optimal conditions. Thus, our laboratory conducted an aging study to
examine the effects of increased levels of Trx1 on oxidative stress and aging under optimal housing conditions [13], using Tg(act-TXN)+/0 mice. Our study demonstrated
that Trx1 overexpression showed a significant increase
in the survival of male Tg(act-TXN)+/0 mice compared to
WT mice only during the first half of their lifespan, but
no increase of lifespan was observed in later part of life.
Tg(act-TXN)+/0 mice showed that the levels of overexpression significantly decreased with age possibly due to the
β-actin promoter driving expression of the transgene [13].
Subsequently, we generated new transgenic mice with
clones of the human TXN gene containing endogenous
promoters [Tg(TXN)+/0] to test the effects of continuous
Trx1 overexpression over the lifespan on aging and agerelated diseases [11]. Tg(TXN)+/0 mice showed some beneficial effects in the earlier part of life but had no significant effects on median or maximum lifespans, which was
accompanied with accelerated cancer development in old
mice [11]. These results are consistent with the observations in Tg(act-TXN)+/0 mice.
The results from two lines of Trx1 transgenic mice clearly
demonstrated that overexpression of Trx1 in cytosol has
beneficial effects only in the earlier part of life. These results also led us to question whether increased expression
of Trx2 in the mitochondria plays more important roles in
aging because the importance of antioxidant overexpression in mitochondria in aging and age-related disease was
strongly suggested by a study using mice overexpressing
catalase in mitochondria [14]. In their study, overexpressing catalase in the mitochondria significantly extended
lifespan and attenuated age-related diseases compared
to their WT littermates, while overexpressing catalase in
the nucleus or peroxisome did not have beneficial effects
on aging [14]. Thus, the purpose of this study was to test
the effects of Trx2 overexpression in the mitochondria on
aging and age-related diseases using male Tg(TXN2)+/0 C57BL/6 mice.
To directly test the effects of Trx2 overexpression
on aging and age-related diseases, we generated the
Tg(TXN2)+/0 mice using the human thioredoxin 2 gene.
Young (4-6 months old) male Tg(TXN2)+/0 mice showed
that levels of Trx2 were significantly higher in all the tissues examined compared to WT control mice. The levels
of Trx2 were 1.6- to 5-fold higher in all of the tissues examined. The increased levels of Trx2 in male Tg(TXN2)+/0 mice did not alter Trx1, glutaredoxin or total glutathione
levels. The activities of major antioxidant enzymes (Cu/
ZnSOD, MnSOD, glutathione peroxidase (GPx), and
catalase) were also similar between young (4-6 months
old) Tg(TXN2)+/0 and WT mice. The Trx2 overexpression suppressed the hydrogen peroxide production from
isolated skeletal muscle mitochondria from both young
(4-6 months old) and old (22-24 months old) Tg(TXN2)+/0 mice compared to WT control mice as expected.
Although the skeletal muscle mitochondria obtained from
Tg(TXN2)+/0 mice showed less hydrogen peroxide production compared to WT control mice, the effects of Trx2
overexpression on oxidative damage were minimal. Plasma isoprostane levels were approximately 13-14% less
in Tg(TXN2)+/0 compared to WT control mice, however,
the levels of DNA oxidation measured by 8-oxodG were
similar between Tg(TXN2)+/0 and WT control mice.
Our survival study showed that the survival curve of male
Tg(TXN2)+/0 mice was not significantly different from WT
control mice. Although the mean, median, and 10th percentile lifespans of male Tg(TXN2)+/0 mice were approximately 8-9% longer than WT control mice, these differences were not statistically significant. The cross-sectional
pathology showed that the total number of tumors (tumor
burden) was similar between Tg(TXN2)+/0 (1.04) and WT
control mice (0.95). The incidence of lymphoma, a major
neoplastic disease, was also similar between Tg(TXN2)+/0 and WT control mice. The severity of lymphoma was
slightly higher in Tg(TXN2)+/0 mice compared to WT
mice, although the difference was not statistically significant. These pathological observations indicate that overexpression of Trx2 in mitochondria may play a similar
role in the development and growth of lymphoma as the
overexpression of Trx1 [11,13], i.e., accelerate the growth
and development of lymphoma as they age.
Subsequently, we measured several signaling pathways
(i.e., mTOR, NFκB, and c-Jun/Fos) because substantial
evidence shows that these pathways play important roles
in cancer development and lifespan and can also be attenuated by Trx. Although overexpression of Trx2 in mitochondria suppressed the ROS production from mitochondria and reduced levels of lipid peroxidation, its effects on
signaling pathways were minimal. Our data showed the
levels of phospho-p70S6K1, phospho-4E-BP1, NFκB p65,
and NFκB p50 were similar between Tg(TXN2)+/0 and
WT littermates, which suggests that the mTOR and NFκB
pathways were not changed by the overexpression of Trx2
in mitochondria. On the other hand, we saw increased levels of c-Jun and c-Fos in Tg(TXN2)+/0 mice compared to
their WT littermates. Activator protein 1 (AP-1), is a complex of proteins of the Jun and Fos families. In mammals,
three Jun proteins (c-Jun, Jun B, and Jun D) and four Fos
family proteins (c-Fos, Fos B, Fra-1, and Fra-2) have been
identified. AP-1 proteins bind to TPA-response elements
(TRE) or AP-1 binding sites to transcriptionally activate
effector genes, which have been shown to stimulate cell
proliferation and transformation. AP-1 DNA binding
activity has been shown to be enhanced by Trx via Ref-1
by the reduction of a single conserved cysteine residue in
the DNA binding domain of each subunit [34]. Therefore,
increased levels of c-Fos and c-Jun may contribute to
slightly accelerated cancer development in Tg(TXN2)+/0 mice.
Although the minimal effects of Trx2 overexpression on
aging and age-related pathology are somewhat disappointing, the outcome of this study along with our previous
works with the mice overexpressing Trx1 could indicate
overexpression of Trx in either cytosol or mitochondria
alone may have limited biological effects. In other words,
synergetic effects of Trx1 and Trx2 may be required to
have more robust effects on pathophysiology during aging. This notion is supported by our recent study that
overexpression of Trx in both the cytosol and mitochondria in TXNTg x TXN2Tg mice unexpectedly had a shorter lifespan and enhanced tumor development compared to
WT mice [35]. To further test the synergetic effects of Trx
overexpression in the cytosol and mitochondria on aging
and age-related disease, our laboratory is currently testing
if the down-regulation of Trx in both the cytosol and mitochondria could have anti-aging and/or anti-cancer effects.
Declarations
Acknowledgments
We acknowledge the Pathology Core in the San Antonio Nathan Shock Center (P30- AG013319) for pathological analyses. This research was supported by the VA Merit Review grant from the Department of Veteran Affairs (Y.I.), NIH grant AG13319 (Y.I.), The American Federation for Aging Research (AFAR) grant (Y.I.), and a grant from the Glenn Foundation (Y.I.).
Conflict of interest
Yuji Ikeno is a member of the Editorial Board of Aging Pathobiology and Therapeutics. All authors declare no conflict of interest and were not involved in the journal’s review or desicions related to this manuscript.
References
1. Arnér ESJ, Holmgren A. Physiological functions of thioredoxin and thioredoxin reductase. Eur J Biochem. 2000;267(20):6102–6109.
2. Brot N, Weissbach L, Werth J, Weissbach H. Enzymatic reduction of protein-bound methionine sulfoxide. Proc Natl Acad Sci USA. 1981;78(4):2155-2158.
3. Brot N, Weissbach H. Peptide methionine sulfoxide reductase: biochemistry and physiological role. Biopolymers. 2000;55(4):288-296.
4. Chae HZ, Kang SW, Rhee SG. Isoforms of mammalian peroxiredoxin that reduce peroxides in presence of thioredoxin. Methods Enzymol. 1999a;300:219-226.
5. Chae HZ, Kim HJ, Kang SW, Rhee SG. Characterization of three isoforms of mammalian peroxiredoxin that reduce peroxides in the presence of thioredoxin. Diabetes Res Clin Pract. 1999b;45(2-3):101-112.
6. Kim K, Kim IH, Lee KY, Rhee SG, Stadtman ER. The isolation and purification of a specific “protector” protein which inhibits enzyme inactivation by a thiol/Fe(III)/ O2 mixed-function oxidation system. J Biol Chem. 1988;263(10):4704-4711.
7. Levine RL, Berlett BS, Moskovitz J, Mosoni L, Stadtman ER. Methionine residues may protect proteins from critical oxidative damage. Mech Ageing Dev. 1999;107(3):323-332.
8. Tagaya Y, Maeda Y, Mitsui A, Kondo N, Matsui H, Hamuro J, Brown N, Arai K-I, Yokota T, Wakasugi H, Yodoi J. ATLderived factor (ADF), an IL-2 receptor/Tac inducer homologous to thioredoxin; possible involvement of dithiol-reduction in the IL-2 receptor induction. EMBO J. 1989;8(3):757-764.
9. Spyrou G, Enmark E, Miranda-Vizuete A, Gustafsson J-A. Cloning and expression of a novel mammalian thioredoxin. J Biol Chem. 1997;272:2936-2941.
10. Takagi Y, Mitsui A, Nishiyama A, Nozaki K, Sono H, Gon Y, Hashimoto N, Yodoi J. Overexpression of thioredoxin in transgenic mice attenuates focal ischemic brain damage. Proc Natl Acad Sci USA. 1999;96(7):4131-4136.
11. Flores LC, Roman MG, Cunningham GM, Cheng C, Dube S, Allen C, Van Remmen H, Hubbard GB, Saunders TL, Ikeno Y. Continuous overexpression of thioredoxin 1 enhances cancer development and does not extend maximum lifespan in male C57BL/6 mice. Pathobiol Aging Age Relat Dis. 2018;8(1):1533754.
12. Mitsui A, Hamuro J, Nakamura H, Kondo N, Hirabayashi Y, Ishizaki-Koizumi S, Hirakawa T, Inoue T, Yodoi J. Overexpression of human thioredoxin in transgenic mice controls oxidative stress and life span. Antioxid Redox Signal. 2002;4(4):693-696.
13. Pérez VI, Cortez LA, Lew CM, Rodriguez M, Webb CR, Van Remmen H, Chaudhuri A, Qi W, Lee S, Bokov A, Fok W, Jones D, Richardson A, Yodoi J, Tominaga K, Hubbard GB, Ikeno Y. Thioredoxin 1 overexpression extends mainly the earlier part of life span in mice. J Gerontol. 2011;66(12):1286-1299.
14. Schriner SE, Linford NJ, Martin GM, Treuting P, Ogburn CE, Emond M, Coskun PE, Ladiges W, Wolf N, Van Remmen H, Wallace DC, Rabinovitch PS. Extension of murine life span by overexpression of catalase targeted to mitochondria. Science. 2005;308:1909-1911.
15. Pérez VI, Lew CM, Cortez LA, Webb CR, Rodriguez M, Liu Y, Qi W, Li Y, Chaudhuri A, Van Remmen H, Richardson A, Ikeno Y. Thioredoxin 2 haploinsufficiency in mice results in impaired mitochondrial function and increased oxidative stress. Free Radic Biol Med. 2008;44(5):882-892.
16. Sun Y, Elwell JH, Oberley LW. A simultaneous visualization of the antioxidant enzymes glutathione peroxidase and catalase on polyacrylamide gels. Free Radic Res Commun. 1988;5(2):67-75.
17. Beauchamp C, Fridovich I. Superoxide dismutase: improved assays and an assay applicable to acrylamide gels. Analyt Biochem. 1971;44(1):276-287.
18. Williams MD, Van Remmen H, Conrad CC, Huang TT, Epstein CJ, Richardson A. Increased oxidative damage is correlated to altered mitochondrial function in heterozygous manganese superoxide dismutase knockout mice. J Biol Chem. 1998;273(43):28510-28515.
19. Muller FL, Song W, Liu Y, Chaudhuri A, Pieke-Dahl S, Strong R, Huang TT, Epstein CJ, Roberts LJ, Csete M, Faulkner JA, and Van Remmen H. Absence of CuZn superoxide dismutase leads to elevated oxidative stress and acceleration of age-dependent skeletal muscle atrophy. Free Rad Biol Med. 2006;40(11):1993-2004.
20. Morrow JD, Roberts II LJ. The isoprostanes: current knowledge and directions for future research. Biochem Pharm. 1996;51(1):1–9.
21. Hamilton ML, Guo Z, Fuller CD, Van Remmen H, Ward WF, Austad SN, Troyer DA, Thompson I, Richardson A. A reliable assessment of 8-oxo-2-deoxyguanosine levels in nuclear and mitochondrial DNA using the sodium iodide method to isolate DNA. Nucleic Acid Res. 2001;29(10):2117-2126.
22. Andersen PK, Borgan O, Gill RD, Keiding N. Statistical models based on counting processes. NewYork: SpringVerlag; 1993.
23. Wang C, Li Q, Redden DT, Weindruch R, Allison DB. Statistical methods for testing effects on “maximum lifespan”. Mech Ageing Dev. 2004;125(9):629-632.
24. Bronson RT, Lipman RD. Reduction in rate of occurrence of age related lesions in dietary restricted laboratory mice. Growth Dev Aging. 1991;55(3):169-184.
25. Ikeno Y, Hubbard GB, Lee S, Richardson A, Strong R, Fernandez E, Diaz V, Nelson JF. Housing density does not influence the longevity effect of calorie restriction. J Gerontol A Biol Sci Med Sci. 2005;60(12):1510-1517.
26. Ikeno Y, Bronson RT, Hubbard GB, Lee S, Bartke A. The delayed occurrence of fatal neoplastic diseases in Ames dwarf mice: correlation to the extended longevity. J Gerontol A Biol Sci Med Sci. 2003;58(4):291-296.
27. Ikeno Y, Hubbard GB, Lee S, Cortez LA, Lew CM, Rodriguez M, Bartke A. Reduced Incidence and Delayed Occurrence of Fatal Neoplastic Diseases in Growth Hormone Receptor/Binding Protein (GHR/BP) Knockout Mice. J Gerontol A Biol Sci Med Sci. 2009;64A(5):522-529.
28. Abate C, Patel L, Rauscher FJ 3rd, Curran T. Redox regulation of Fos and Jun DNA-binding activity in vitro. Science. 1990;249:1157-1161.
29. Galter D, Mihm S, Droge W. Distinct effects of glutathione disulphide on the nuclear transcripton factor kB and the activator protein-1. Eur J Biochem. 1994;221:639-648.
30. Toledano MB, Leonard WJ. Modulation of transcription factor NF-KB binding activity by oxidation-reduction in vitro. Proc Natl Acad Sci USA. 1991;88:4328-4332.
31. Matsui M, Oshima M, Oshima H, Takaku K, Maruyama T, Yodoi J. Early embryonic lethality caused by targeted disruption of the mouse thioredoxin gene. Dev Biol. 1996;178(1):179-185.
32. Nonn L, Williams RR, Erickson RP, Powis G. The absence of mitochondrial thioredoxin 2 causes massive apoptosis, exencephaly, and embryonic lethality in homozygous mice. Mol Cell Biol. 2003;23(3):916-922.
33. Yoshihara E, Masaki S, Matsuo Y, Chen Z, Tian H, Yodoi J. Thioredoxin/Txnip: Redoxisome, as a redox switch for the pathogenesis of diseases. Front Immunol. 2013;4:514.
34. Wei SJ, Botero A, Hirota K, Bradbury C M, Markovina S,Laszlo A, Spitz DR, Goswami PC, Yodoi J, Gius D. Thioredoxin nuclear translocation and interaction with redox factor-1 activates the activator protein-1 transcription factor in response to ionizing radiation. Cancer Res. 2000;60:6688-6695.
35. Cunningham GM, Flores LC, Roman MG, Cheng C, Dube S, Allen C, Valentine JM, Hubbard GB, Bai Y, Saunders TL, Ikeno Y. Thioredoxin overexpression in both the cytosol and mitochondria accelerates age-related disease and shortens lifespan in male C57BL/6 mice. Geroscience. 2018;40(5-6):453-468.