Open Access | Research Article
This work is licensed under a Creative Commons Attribution-ShareAlike 4.0 International License.
Finding prodromal frailty in a community-dwelling healthy older cohort by survey of BDNF or hand grip strength classifed by BMI
* Corresponding author: Mitsugu Hachisu
Mailing address: Department of Pharmaceutical Therapeutics, Division of Clinical Pharmacy, Pharmacy School, Showa
University, 1-5-8 Hatanodai, Shinagawa-ku, Tokyo 142-8555,
Japan.
E-mail: mhachisu@pharm.showa-u.ac.jp
Received: 24 July 2020 / Accepted: 22 Septemper 2020
DOI: 10.31491/APT.2020.09.031
Abstract
Background: Frailty, which is losing body weight or lean body mass, experiencing fatigue and loss of strength
or endurance, can easily result in falls and fractures with hospitalization and bedridden conditions. Brain-derived neurotrophic factor (BDNF), which is involved in neurogenesis, phenotypic differentiation, and neuronal
survival, is gaining traction in the field of gerontology research as a relevant factor in cognition and vitality in
the older population. We studied a distribution of mean BDNF levels or hand grip strengths according to BMI
classification, and found the lowest BMI class of thin category had significantly (p < 0.01) lower mean BDNF
level or mean hand grip strength than in the normal or obese 1 category of BMI. Therefore we defined the lowest BMI category “thin” as “prodromal frailty”, but not pre-frailty. We report the findings of “prodromal frailty”
and discuss how to prevent this stage from advancing to frailty.
Methods: We measured serum BDNF concentrations, BMI and various health parameters in 805 elderly (aged
65–84) regional health examination participants from the Tokyo area. Their serum BDNF levels and grip
strengths were divided according to BMI classification.
Results: The mean serum BDNF levels increased linearly according to BMI categorization from thin ( < 18.4
kg/m2) to obese 2 (30–34.9 kg/m2) and decreased in the obese 3 group (35–39.9 kg/m2). The mean serum
BDNF level in the thin category was significantly lower than that in the normal category (p < 0.01). The BDNF
levels in the obese 1 and obese 2 categories did not differ significantly from that in the normal category. Mean
hand grip strength (kg) was also similarly distributed to the mean BDNF level distribution in the classified
BMIs.
Conclusions: Older people in the thin BMI category had significantly lower serum BDNF levels and weaker
hand grip strength than those in the normal or slightly obese categories, placing them in the conditon of “prodromal frailty” but not pre-frailty.
Keywords
Frailty, body mass index, brain-derived neurotrophic factor, health examination, hand grip strength
Introduction
Brain-derived neurotrophic factor (BDNF) which plays a
role in neurogenesis, phenotypic differentiation, and neuronal survival, is reported to be related to depression and
Alzheimer’s disease [1-4]. It was found that serum BDNF level increases after exercise, and the repeated exercise
enhances mood or cognitive functions in elderly people
as well as mild cognitive impairment (MCI) patients [5].
Therefore, BDNF is gaining traction in the feld of gerontology research and is considered relevant to the vitality
of individuals. Older people who are losing weight or
have low body mass reported fatigue, loss of strength and
endurance. Fried et al. [6] defined frailty, in a study of
more than 5,000 US community elderly people, as fulflling three of the fve following criteria; 1) lowering body
weight, 2) weakness shown as reduced hand grip strength,
3) poor endurance and energy, 4) slowness, evidenced
by slow gait speed and performance, and 5) low physical
activity levels [6]. Once older people become frail they
easily fall and fracture bones, which results in hospitalization and then becoming bedridden. Furthermore, frailty
increases the risk of morbidity for various other diseases,
including psychiatric problems such as deterioration of
cognition and depression [7]. Ingres et al. [8] and Coelho
et al. [9] reported association of frailty with low serum
BDNF levels and cognition deterioration and they noted
that interventions such as exercise improved symptoms of
both frailty and cognition deterioration.
In our previous study, we reported a relationship between
serum BDNF level and BMI in elderly people using a
regression analysis [10]. In this report, we discovered
significantly lower BDNF levels and weaker hand grip
strength in one BMI category compared to that of others.
These categories were classifed according to the Japanese
Society for the Study of Obesity (JASSO). Although our
cohort contained healthy subjects, who were invited to
participate in a medical examination, we found there were
some “prodromal frailty”, but not pre-frailty in the cohort.
Therefore, we report the occurrence of “prodromal frailty”
in the healthy subjects and discuss measures that can prevent the shift from “prodromal frailty” stage to frailty in
these subjects, with respect to serum BDNF levels.
The demographic data and their relation to serum BDNF
levels are as follows [10]: the mean participant age was
73.2 (SD: 4.9) years and the mean serum BDNF level
was 9.40 (SD: 4.06) ng/mL (n = 805) among those 65–84
years of age with distributing normally and was no sex
difference. Individuals with cardiovascular disease represented 16.4% of the cohort and their BDNF levels were
signifcantly lower than that of people without cardiovascular disease. Hypertension, hyperlipidemia, and diabetes
mellitus was reported in 45.5%, 30.7%, and 11.8%, of
the cohort, respectively. The serum BDNF levels of these
participants did not differ from that in healthy people. The
use of medicines such as anti-hypertensive drugs, anti-inflammatory drugs, hypnotics, anxiolytics, and osteoporosis drugs was reported in 43.6%, 9.2%, 14.0%, 7.7%, and
12.0% of participants, respectively. The serum BDNF levels in subjects taking hypnotics for less than 1 year were
significantly lower and significantly higher in subjects
taking hypnotics for more than 1 year than in subjects not
taking hypnotics. The serum BDNF levels in participants
taking medicines other than hypnotics were not different
from participants taking no medicines.
Materials and Methods
Participants
Participants undergoing medical health examinations were
recruited by the Tokyo Metropolitan Institute of Gerontology as previously described [10]. Briefly, we sent a letter
to 7,162 community-dwelling elderly individuals aged
65–84 years to invite them to participate in a medical
health examination in the Tokyo area; of these 805 participants were willing to undergo the examination. We used
a “yes” or “no” questionnaire to investigate past diseases,
and the use of medicines was classified into the following categories: “taking no medicines”, “taken within one
year”, and “taken for more than one year”.
We obtained informed consent to perform the medical
health examination, including blood collection, following
oral explanations provided before the examination. Subjects with low basic activities of daily living (ADL) based
on Katz Index under 3 points, severe visual and auditory
disorders, severe post-stroke symptoms, and cognitive
impairment with MMSE (Mini-mental state examination)
scores under 24 were excluded [10].
We assert that all procedures contributing to this study
complied with the ethical standards of the relevant national committees on human experimentation. The study was
conducted in accordance with the Declaration of Helsinki
(as revised in Brazil 2013), and the protocol was approved
by the Ethics committee of the Showa University School
of Pharmacy (Approval No. 160, August 4, 2012).
Measurements of BMI, %BFM, and hand grip strength
Total body fat mass was measured using a Well-scan multi-frequency bioelectrical impedance analyzer (Elk Corporation, Japan) and expressed as %BFM. BMI was calculated as body weight (kg)/height (m2). Handgrip strength was measured once in each hand using a Smedley grip dynamometer (As One, Osaka, Japan) before the blood withdrawing and the higher value was incorporated for the data.
Measurement of serum BDNF concentrations
Blood was drawn at the end of health examinations and was centrifuged 1,500 x g, at 4 degrees centigrade for 15min. The sera were transferred to a new set of polyethylene tubes and stored at -80 degrees centigrade until measurement. The serum BDNF levels were measured by an enzyme-linked immunosorbent assay using the BDNF Emax immunoassay system (Promega Corp., Madison, WI, USA.) according to the supplier protocol [10]. All samples were assayed in duplicate.
Statistical analysis
We used Student’s t-tests to compare hand grip strength between male and female, and an analysis of variance (ANOVA) to compare BDNF levels across BMI or %BFM categories and hand grip strengths across BMI categories. Then, the BDNF level or hand grip strength in each BMI class was analyzed with multiple comparisons using the Bonferroni correction. The differences were considered statistically signifcantly when they had p < 0.05. We used PASW Statistics for Windows, version 18.0 to perform all statistical analyses (SPSS Inc., Chicago, IL, USA).
Results
Serum mean BDNF levels in each BMI classifcation
We re-analyzed the distribution of mean serum BDNF levels according to BMI classification. The BMI was classifed as thin ( < 18.4 kg/m2), normal (18.5–24.9 kg/ m 2), obese 1 (25.0–29.9 kg/m2), obese 2 (30.0–34.9 kg/ m 2), obese 3 (35–39.9 kg/m2) and obese 4 (over 40 kg/m2) based on the JASSO classifcation [11]. The distribution of subjects among the BMI categories is summarized in Table 1. The mean serum BDNF levels increased linearly from thin to obese 2, then decrease in the obese 3 category (Figure 1). The mean serum BDNF level in the normal category was signifcantly (p < 0.01) higher than that in the thin category, while it is not significant from obese 1 category or obese 2 category, respectively (Figure 1). Moreover, the BDNF levels in the thin category were also significantly lower than those in the obese 1 (p < 0.01) and obese 2 (p < 0.05) categories.
.png)
Figure 1. Serum BDNF levels in each BMI classifcation. The BDNF levels in each BMI category were expressed mean ± SD and analyzed by ANOVA (Levene’s test F value 2.1783, p = 0.0697). Multiple comparison was performed using the Bonferroni correction. The data is expressed when compared with the normal BMI category of 18.5–24.9 kg/m2. **p < 0.01, NS: no signifcant. BDNF: brain-derived neurotrophic factor, BMI: body mass index.
Table1
Distribution of subjects depending on BMI classification.
The BMI classifcation and the category are followed by Japanese Society for the Study of Obesity [11].
| BMI classifcation | Category | Number of subjects (%) |
|---|---|---|
| < 18.4 | thin | 67 (8.3%) |
| 18.5–24.9 | normal | 548 (68.1%) |
| 25–29.9 | obese 1 | 165 (20.5%) |
| 30–34.9 | obese 2 | 0.185 ± 0.024 |
| Heart (g) | 0.177 ± 0.006 | 20 (2.5%) |
| 35–39.9 | obese 3 | 5 (0.6%) |
| > 40 | obese 4 | 0 (0%) |
Serum mean BDNF levels in %BFM classifcations
We analyzed the distribution of mean serum BDNF concentrations across %BFM categories. %BFM was classified according to 5% point intervals from below 14.9% to over 40% using a modified %BFM chart described by Tanita [12]. The distribution of subjects based on %BFM classifcation is shown in Table 2.The mean %BFM values did not differ between men and women in our older cohort (27.7 ± 7.4% [n = 304] and 27.2 ± 6.2 % [n = 501], respectively). As the mean ± SD %BFM of males and females was almost the same in the present cohort, we employed the modifed Tanita’s classifcation of %BFM for male aged 60 and higher [12] to categorize the cohort irrespective of gender. The mean serum BDNF levels in each %BFM category increased linearly from under 14.9%BFM to over 40%BFM. However, the mean serum BDNF level in the under 14.9%BFM category (7.6 ± 3.0 ng/mL) was not signifcantly different from that in the other %BFM categories (Figure 2).
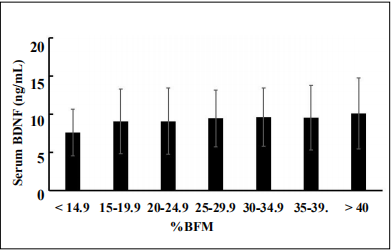
Figure 2. Serum BDNF levels at %BFM classifcations at 5% steps from < 14.9% to > 40.0. The BDNF levels in each %BFM category were expressed as mean ± SD and analyzed by ANOVA (Levene’s test F value 0.5393, p = 0.7785). Multiple comparison was performed using the Bonferroni correction. There was no signifcance when compared with the %BFM of < 14.9%.
Table2
Distribution of subjects depending on BMI classification.
The %BFM was classifed with the 5% point of steps, and it is categorized by the modifed %BFM chart described by Tanita [12].
| BMI classifcation | Category | Number of subjects (%) |
|---|---|---|
| < 14.9 | thin | 24 (3.0%) |
| 15–19.9 | standard [-] | 68 (8.5%) |
| 20–24.9 | standard [+] | 176 (21.8%) |
| 25–29.9 | pre-obese | 244 (30.3%) |
| 30–34.9 | obese i | 201 (25.0%) |
| 35–39.9 | obese ii | 78 (9.7%) |
| > 40 | obese iii | 14 (1.7%) |
Hand grip strength in each classifed BMI
The mean hand grip strength in our cohort was 25.5 ± 7.84 kg, exhibiting a signifcant difference (p < 0.01) between males (32.1 ± 6.99 kg) and females (21.21 ± 4.75 kg). The distributions of mean hand grip strengths in the classifed BMI category from thin to obese 3 are shown in Figure 3. The mean hand grip strength in the thin BMI category (21.4 ± 6.4 kg) was significantly (p < 0.01) lower than that in the normal BMI (25.4 ± 5.4 kg), obese 1 and obese 2 categories. Further, the mean hand grip strength in the normal BMI category was signifcantly lower than that in the obese 1 category (p < 0.05). Hence, hand grip strength was lowest in the thin BMI category (Figure 3).
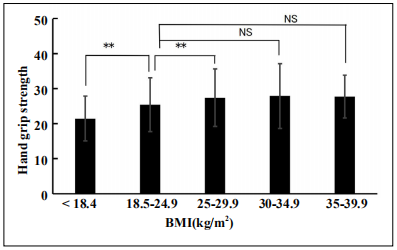
Figure 3. Handgrip strengths (kg) in each BMI classifcation. The hand grip strengths in each BMI category were expressed mean ± SD and analyzed by ANOVA (Levene’s test F value 3.2310, p = 0.01). Multiple comparison was performed using the Bonferroni correction. The data is expressed when compared with the normal BMI category of 18.5– 24.9 kg/m2. **p < 0.01, *p < 0.05, NS: no signifcant. BDNF: brain-derived neurotrophic factor, BMI: body mass index.
Discussion
The mean ± SD BMI in this cohort of community-dwelling individuals in the Tokyo area was 22.8 ± 3.4 kg/m2
(23.1 ± 3.1 kg/m2 in male and 22.6 ± 3.2 kg/m2 in female
participants). The reported BMIs among communitydwelling individuals aged 60 years and over in rural and
urban areas of Indonesia were 22.7 ± 2.2 and 24.9 ± 3.4
kg/m2, respectively [13]. In the Programa Municipal da
Terceira Idade (PMTI) program in Vicosa, Minas Gerais,
Brazil, the mean BMI was 27.4 kg/m2 among those aged
60 years and over (average 72 years), and about half were
overweight [14]. The BMI in the current cohort of community-dwelling individuals in the Tokyo area was close
to that in the rural area of Indonesia and lower than that in
Brazil. Assessment of the distributions of the participants
by BMI classifcation showed that 68.1% and 8.3% were
the normal and thin categories, respectively, among those
aged 65–84 years in the Tokyo area (Table 1). Among
12,544 participants of the US National Health and Nutrition Examination Survey (NHANES) aged over 20 years,
1.4% and 30.6% were in the thin and normal BMI categories [15], proportions 1/6 and 1/2 those in our cohort,
respectively.
The mean ± SD %BFM in our cohort was 27.4 ± 6.3 %
(male 27.7 ± 6.4 % and female 27.2 ± 6.2%), and was
comparable between males and females. This cohort is
unique as the %BFM in females is generally higher than
that in males [12, 13]. The %BFM is increased with age in
males and remained steady in females; therefore, the values were comparable between sexes [16].
In this study, the mean serum BDNF levels in classified
BMI increased linearly from the thin to obese 2 BMI categories and decrease in the obese 3 category. Unexpectedly, the mean serum BDNF level in the thin category was
signifcantly lower than that in the normal BMI category
(p < 0.01). However the mean BDNF level in normal BMI
is not signifcantly different from that in obese 1, obese 2
and obese 3, respectively.
Nanri et al. [17] reported results that were similar to our
fndings, they reported that the mean serum BDNF levels
in the BMI categories from < 21.0 to > 27.0 showed signifcant positive correlation in Japanese participants aged
18-70. Unfortunately, there was no classifcation of thin
(< 18.4) BMI category in this cohort. Moreover, fndings
consistent with our data on the positive correlation of serum BDNF and BMI were reported by Golden et al. [18]
in older women (70.3 ± 0.76 years old) from the US and
by Suwa et al. [19] in Japanese women with type 2 diabetes mellitus aged 34-59 years; however there were also
no classification of thin BMI category in these reports.
On the other hand, no correlation between plasma BDNF
levels and BMI was reported in older people aged 60-81
years from the US [20].
With respect to %BFM and serum BDNF levels, a positive relationship was reported by the regression analysis in
our previous report [10]. When we categorized the %BFM
at 5% point interval from under 14.9% to over 40%, the
mean BDNF level in the < 14.9%BFM category was not
significantly different from that of the other categories.
The accumulation of BFM influences various metabolic
activities, especially obesity. Obesity tends to be insulinresistant with the development of low-grade inflammation,
including an increase in inflammatory cytokines such as
interleukin 6 (IL-6) [21]. Inflammatory cytokines inhibit
BDNF expression, thereby decreasing serum BDNF level
[22]. Moreover, it has been reported that the circulating
BDNF levels are decreased in patients with diabetes mellitus showing symptoms of nephropathy and retinopathy
[23, 24]. Since Keys et al. [25] reported that there is a
strong correlation between BMI and BFM, BMI is currently used as an index of obesity. Indeed, BMI was also
well correlated with %BFM (r = 0.9912, p = 0.01) in our
cohort, while there are some difference in the distribution
pattern of mean BDNF levels in the BMI classification
and those in %BFM classification as shown at results.
Low BMI or BFM indicates thinness while low BMI indicates not only low BFM but also low muscle mass, as
BMI is calculated as the body weight (kg) divided by the
square of the height (m2). Muscle mass and BDNF levels
are positively correlated [26], while increased BFM decreased BDNF levels through inflammation, as described
above. Therefore, it can be interpreted by the previous
logic that the BDNF level in the lowest BMI of the thin
category was significantly lower than that in normal,
obese 1 and obese 2 categories, while the BDNF level in
the lowest %BFM category was not signifcantly different
from other categories of %BFM.
Low muscle mass may cause sarcopenia and frailty. We
observed significantly lower serum BDNF levels in the
thin BMI category than that in the normal BMI category.
Frailty is a condition characterized by weakness with low
body weight and low activity that is sometimes also reported to include reduced mood and cognition [7]. Ingles
et al. [8] reported lower plasma BDNF levels in frail individuals than those non-frail individuals, which was associated with lower cognition.
We observed signifcantly lower hand grip strength in the
thin BMI category than that in the normal, obese 1, and
obese 2 BMI categories. This pattern was similar to the
distribution observed for serum BDNF levels according
to BMI classifcation. The fve frailty criteria proposed by
Fried et al include “weakness: reduced hand grip strength”
[6]. The thin BMI category showed low serum BDNF
levels and weak hand grip strength. Moreover, individuals with frailty reportedly show low levels of circulating
BDNF [8]. Therefore, individuals in the thin BMI category with low BDNF levels and weak hand grip strength in
our cohort likely corresponded to “prodromal frailty” but
not pre-frailty.
We previously reported higher serum BDNF concentrations in individuals with thick quadriceps muscles [10].
These individuals may receive adequate physical exercise
in their daily lives. Physical exercise reportedly increases
serum BDNF levels in both pre-frail and non-frail women[27]. Moreover, the authors suggested that BDNF levels may be a key pathophysiological mediator in frailty.
Therefore, we first showed the presence of “prodromal
frailty” in a healthy cohort of community-dwelling individuals with low BDNF levels, weak handgrip strength,
and low BMI. Individuals in the thin category with low
BDNF levels should start exercising and ingest proper nutrition with high protein levels to prevent frailty. Because,
it is reported that the older adults with higher muscle mass
showed a low mortality risk in a 10–16-year longitudinal follow-up study in the US [28]. Therefore, resistance
training, especially hypertrophied resistance training, is
recommended to increase muscle mass [29-31] at 8 to 12
reps per set for more than three sets [29]. Leg exercises;
i.e., squats, are recommended for hypertrophied thigh
muscle, one of the largest muscles in the body, for prevention of fall and slowed gait speed associated with frailty.
Consumption of high protein and/or amino acid diets reverse frailty and increase strength and muscle mass with
elevated levels of circulating BDNF [32].
There are some limitations in this study. The cohort was
comprised of individuals who were interested in and paying attention to their health, who presented to the institute
at their own volition and mostly by themselves. Therefore,
the cohort may be representative of vital older people
rather than average community-dwelling older individuals
aged 65-84 years in the Tokyo area. Moreover, the observations were made on a single day rather than as part of a
longitudinal study; therefore, BMI or %BFM changes in
individuals do not explain their changes in BDNF level.
BMI is a well-known assessment of the level of fat (obese)
in the human body and it is calculated by an equation [body
weight (kg) / height (m2)], therefore it also includes muscle mass. Therefore, we cannot conclusively show that
the presence of “prodromal frailty” in the thin category of
BMI depends on the level of muscle mass or BFM. However, due to the ease of calculating BMI, it was employed
to analyze the presence of “prodromal frailty” in a large
cohort.
In summary, older people in the thin BMI category had
signifcantly lower serum BDNF levels and weaker hand
grip strength than those in the normal or slightly obese
categories. The thin category with fndings of low BDNF
levels and weak hand grip strength was designated as
“prodromal frailty”.
Declarations
Acknowledgements
We acknowledge support for this study from a Health and Labor Sciences Research Grant (H23-Choju-Ippan-001, H23-Choju-Ippan-002) and a JSPS KAKENHI research Grant (grant number: 21590717). We would like to thank Editage (www.editage.com) for English language editing.
Authors’ Contributions
Conceptualization, M.H. and K.I.; data curation, H.K.; formal analysis, M.H. and M.H.; investigation, M.H., M.H., H.K., H.H., M.K., Y.F., S.O., M.K., M.O., N.K., M.T., and K.I.; project administration, H.K., H.H., M.K., Y.F., S.O., and K.I.; resources, S.O. and K.I.; writing–original draft, M.H.; writing–review & editing, M.H., M.K., M.O., N.K., M.T. and K.I. All authors have read and agreed to the published version of the manuscript.
Financial supports
We received support for this study from a Health and Labor Sciences Research Grant (H23- Choju-Ippan-001, H23-Choju-Ippan-002) and a JSPS KAKENHI research Grant (grant number: 21590717).
Conflicts of Interest
The authors declare no conflict of interest.
Ethical approval and informed consent
We assert that all procedures contributing to this study complied with the ethical standards of the relevant national committees on human experimentation. The study was conducted in accordance with the Declaration of Helsinki (as revised in Brazil 2013), and the protocol was approved by the Ethics committee of the Showa University School of Pharmacy (Approval No. 160, August 4, 2012). We obtained informed consent to perform the medical health examination, including blood collection, following oral explanations provided before the examination.
References
1. Ihara K, Yoshida H, Jones P B, et al. Serum BDNF levels before and after the development of mood disorders: a case–control study in a population cohort. Translational psychiatry, 2016, 6(4): e782-e782.
2. Yoshimura R, Mitoma M, Sugita A, et al. Effects of paroxetine or milnacipran on serum brain-derived neurotrophic factor in depressed patients. Progress in NeuroPsychopharmacology and Biological Psychiatry, 2007, 31(5): 1034-1037.
3. Leyhe T, Stransky E, Eschweiler G W, et al. Increase of BDNF serum concentration during donepezil treatment of patients with early Alzheimer’s disease. European Archives of Psychiatry and Clinical Neuroscience, 2008, 258(2): 124-128.
4. Duman R S. Synaptic plasticity and mood disorders. Molecular psychiatry, 2002, 7(1): S29-S34.
5. Anderson-Hanley C, Barcelos N M, Zimmerman E A, et al. The aerobic and cognitive exercise study (ACES) for community-dwelling older adults with or at-risk for mild cognitive impairment (MCI): neuropsychological, neurobiological and neuroimaging outcomes of a randomized clinical trial. Frontiers in aging neuroscience, 2018, 10: 76.
6. Fried L P, Tangen C M, Walston J, et al. Frailty in older adults: evidence for a phenotype. The Journals of Gerontology Series A: Biological Sciences and Medical Sciences, 2001, 56(3): M146-M157.
7. Albala C, Lera L, Sanchez H, et al. Frequency of frailty and its association with cognitive status and survival in older Chileans. Clinical interventions in aging, 2017, 12:995.
8. Inglés M, Gambini J, Mas-Bargues C, et al. Brain-derived neurotrophic factor as a marker of cognitive frailty. The Journals of Gerontology: Series A, 2017, 72(3): 450-451.
9. Coelho F M, Pereira D S, Lustosa L P, et al. Physical therapy intervention (PTI) increases plasma brain-derived neurotrophic factor (BDNF) levels in non-frail and prefrail elderly women. Archives of gerontology and geriatrics, 2012, 54(3): 415-420.
10. Hachisu M, Hashizume M, Kawai H, et al. Relationships between serum brain-derived neurotrophic factor concentration and parameters for health scores in community-dwelling older adults[J]. Geriatrics & gerontology international, 2018, 18(3): 456-461.
11. Ministry of Health, Labor and Welfare Health information site for prevention of lifestyle-related diseases on December 17, 2019. Available online: https://www.ehealthnet.mhlw.go.jp/information/food/e-02-001.html
12. TANITA Worldwide. How to read the measurement items of the body composition monitor. 2020. Available online: https://www.tanita.co.jp/health/measure/taisoseikei/
13. Hanindriyo L, Widita E, Widyaningrum R, et al. Influence of residential characteristics on the association between the oral health status and BMI of older adults in Indonesia. Gerodontology, 2018, 35(3): 268-275.
14. Gonçalves D F, Tinoco A L A, Ribeiro R C L, et al. Nutritional status and epidemiological profile of elderly people. Archives of gerontology and geriatrics, 2012, 55(1): 1-4.
15. Abramowitz M K, Hall C B, Amodu A, et al. Muscle mass, BMI, and mortality among adults in the United States: A population-based cohort study. PloS one, 2018, 13(4): e0194697.
16. Campisi J, Finn K E, Bravo Y, et al. Sex and age-related differences in perceived, desired and measured percentage body fat among adults. Journal of Human Nutrition and Dietetics, 2015, 28(5): 486-492.
17. Nanri A, Kochi T, Eguchi M, et al. Demographic and lifestyle correlates of brain-derived neurotrophic factor in a working population: The Furukawa Nutrition and Health Study. Psychiatry research, 2019, 272: 581-586.
18. Golden E, Emiliano A, Maudsley S, et al. Circulating brain-derived neurotrophic factor and indices of metabolic and cardiovascular health: data from the Baltimore Longitudinal Study of Aging. PLoS one, 2010, 5(4): e10099.
19. Suwa M, Kishimoto H, Nofuji Y, et al. Serum brainderived neurotrophic factor level is increased and associated with obesity in newly diagnosed female patients with type 2 diabetes mellitus. Metabolism, 2006, 55(7): 852-857.
20. Pillai A, Bruno D, Sarreal A S, et al. Plasma BDNF levels vary in relation to body weight in females[J]. PLoS One, 2012, 7(7): e39358.
21. Mauer J, Chaurasia B, Goldau J, et al. Signaling by IL-6 promotes alternative activation of macrophages to limit endotoxemia and obesity-associated resistance to insulin. Nature Immunology, 2014, 15: 423-430.
22. Dhanda S, Gupta S, Halder A, et al. Systemic inflammation without gliosis mediates cognitive deficits through impaired BDNF expression in bile duct ligation model of hepatic encephalopathy. Brain, behavior, and immunity, 2018, 70: 214-232.
23. Kurajoh M, Kadoya M, Morimoto A, et al. Plasma brainderived neurotrophic factor concentration is a predictor of chronic kidney disease in patients with cardiovascular risk factors–Hyogo Sleep Cardio-Autonomic Atherosclerosis study. Plos one, 2017, 12(6): e0178686.
24. Guo M, Liu H, Li S, et al. Low serum brain-derived neurotrophic factor but not brain-derived neurotrophic factor gene Val66met polymorphism is associated with diabetic retinopathy in Chinese type 2 diabetic patients. Retina, 2017, 37(2): 350-358.
25. Keys A, Fidanza F, Karvonen M J, et al. Indices of relative weight and obesity. Journal of chronic diseases, 1972, 25(6-7): 329-343.
26. Máderová D, Krumpolec P, Slobodová L, et al. Acute and regular exercise distinctly modulate serum, plasma and skeletal muscle BDNF in the elderly. Neuropeptides, 2019, 78: 101961.
27. Coelho F M, Pereira D S, Lustosa L P, et al. Physical therapy intervention (PTI) increases plasma brain-derived neurotrophic factor (BDNF) levels in non-frail and prefrail elderly women. Archives of gerontology and geriatrics, 2012, 54(3): 415-420.
28. Srikanthan P, Karlamangla A S. Muscle mass index as a predictor of longevity in older adults. The American journal of medicine, 2014, 127(6): 547-553.
29. Marston K J, Newton M J, Brown B M, et al. Intense resistance exercise increases peripheral brain-derived neurotrophic factor. Journal of science and medicine in sport, 2017, 20(10): 899-903.
30. Dinoff A, Herrmann N, Swardfager W, et al. The effect of exercise training on resting concentrations of peripheral brain-derived neurotrophic factor (BDNF): a metaanalysis. PLoS one, 2016, 11(9): e0163037.
31. Marston K J, Newton M J, Brown B M, et al. Intense resistance exercise increases peripheral brain-derived neurotrophic factor. Journal of science and medicine in sport, 2017, 20(10): 899-903.
32. Lorenzo-López, L., Maseda, A., de Labra, C., RegueiroFolgueira, L., Rodríguez-Villamil, J. L., & Millán-Calenti, J. C. (2017). Nutritional determinants of frailty in older adults: a systematic review. BMC geriatrics, 17(1), 108.