Open Access | Research Article
This work is licensed under a Creative Commons Attribution-ShareAlike 4.0 International License.
Resilience to acute sleep deprivation is associated with attenuation of hippocampal mediated learning impairment
* Corresponding author: Warren Ladiges
Mailing address: Department of Comparative Medicine, School
of Medicine, University of Washington, Seattle, WA, USA.
E-mail: wladiges@uw.edu
Received: 30 November 2020 / Accepted: 15 December 2020
DOI: 10.31491/APT.2020.12.040
Abstract
Background: Sleep deprivation is a universal issue that affects individuals in different ways. While some
individuals experience a deficit in performance, others experience resiliency as they maintain high levels of
physical and mental activity. Sleep loss is known to cause cognitive dysfunction in areas such as learning and
memory, but little is known about neural mechanisms that contribute to resilience to this adverse effect.
Methods: An existing database of a learning paradigm in sleep deprived and non-sleep deprived 16 to
18-month old C57BL/6 mice was used to identify fast learners and slow learners based on an R2 value representing the learning curve of each individual mouse.
Results: Results showed that sleep deprived mice had more slow learners compared to fast learners whereas
non-sleep-deprived mice showed the opposite. Hippocampal immunohistochemistry and digital imaging analysis showed sleep deprived, fast learners expressed lower levels of monocyte chemoattractant protein-1 and
histone deacetylase 2 and higher levels of synaptophysin and brain-derived neurotrophic factor compared to
sleep-deprived slow learners.
Conclusions: These observations provide evidence to suggest that sleep-deprived mice that performed well in
a cognitive assay show less hippocampal mediated learning impairment and provide the rationale for further
investigations into neurobiological resilience to sleep deprivation with increasing age.
Keywords
Sleep deprivation, resiliency, learning impairment, aging, neuropathology, hippocampus
Introduction
Environmental adversity can often lead to stress as a biological reaction. The human body reacts to stress by activating the hypothalamic-pituitary-adrenal (HPA) axis and
producing stress hormones such as glucocorticoids and
cortisol [1]. Dysregulation and chronic exposure to the
stress response can then lead to adverse health outcomes.
However, stress does not affect everyone in the same way.
Individuals in the population who have enhanced stress
resilience mechanisms can adapt successfully to stress
without the burden of illnesses. Increased resiliency to
stress also contributes to a slower aging process and improved overall health and quality of life. Individuals that
are less vulnerable to stress and its adverse health effects
are deemed resilient [2].
The study of resilience is more common among younger
study populations, but less so when it comes to older
adults [3]. The aging process itself is one of the most
challenging public health issues faced by developed countries. By 2050, the number of people over 65 years old is
expected to reach 1.5 billion, nearly tripling the amount
in 2010 [4]. This rapid demographic change will put more
stress on various social infrastructure systems in countries
around the world. With the growth in aged populations,
there has been an expansion in initiatives and interventions to promote successful aging [5]. The topic of resilience is a rapidly growing field of interest in research, especially in older adults and the impact it has on successful
aging. Aging well has many components, such as being
free from chronic disease and maintaining a high level of
physical and mental function [6].
Sleep is an essential component of energy conservation
and homeostasis of multiple physiological and behavioral
processes [7]. The American Academy of Sleep Medicine
and the National Sleep Foundation recommend that adults
sleep at least 7 hours per day [8,9]; however, the increasing demand for long work shifts and “around-the-clock” work has led to a marked reduction in the average sleep
duration in developed countries [10,11]. Sleep deprivation
leads to numerous cognitive and behavioral effects, such
as increased reaction to stress, emotional changes, and a
lack of impulse control [12]. The issue of sleep loss has
become so pervasive in society that the Center for Disease
Control has recently elevated it to public health epidemic
status [13]. However, research has also shown that some
individuals are vulnerable while others are resistant to
sleep deprivation [14, 15]; notably, this phenotypic stability is maintained across months and years [15]. Approximately a third of healthy adults show high levels of
decreased performance when moderately sleep deprived.
Another third displays moderate deficits while the final
third shows little to no decrease in performance even with
severe sleep loss. The underlying reasons for such differential neurobehavioral vulnerability to sleep loss are
mostly unknown and unexplained by demographic and
other factors [16-18]. To date, there have been studies
looking at different genetic approaches to relate biomarkers to sleep deprivation responses, although the specific
mechanisms for these relationships are currently not fully
understood [14].
Phenotypic characteristics of resilience to sleep deprivation should be determined before investigating genetic differences. In this regard, we have developed a mouse model of short-term sleep deprivation and a spatial navigation
task (Box maze) designed to assess learning behavior in a
time-effective and relatable manner [19]. Therefore, sleep
deprivation as a stressor can be used to exploit the cognitive impairments that arise thus facilitating the study of
innate resiliency in individual mice [20-22]. In this study,
we used an existing database of sleep-deprived mice and
analyzed Box maze data from previous studies. We report
that sleep-deprived mice that performed well in a Box
maze cognitive learning assay show less hippocampal
mediated learning impairment, providing the rationale for
further investigations into neurobiological resilience with
increasing age.
Methods
Box maze database
Data were used from a Box maze database that had been deposited for over two years on a shared Google drive representing a number of studies from the senior authors’ laboratory. The data used for this report were from 16 to 18-month-old male C57BL/6 (B6) mice provided by the National Institute on Aging Aged Rodent Colony (Charles River, Inc). After extensive mining of all available data from the drive, a total of n=40 mice were suitable for the hypothesis being tested. Half of the mice underwent learning assessment after being exposed to a short term sleep deprivation protocol while the remaining half were those kept on a standard sleeping cycle. Housing and maintenance have been previously described [19].
Grading platform
The box maze produces data in the form of escape latencies with four trials per mouse. This raw data can then be plotted on a graph through programs such as Excel, Graphpad Prism, etc. The grading platform further defines the escape latencies with a single value known as the coefficient of determination (R2 ). After plotting the raw data, a logarithmic trend line can be applied to the data points in which the R2 value and slope are observed for each mouse. If the slope is positive, the mouse is graded as a slow learner whereas mice with a negative slope tend to be fast learners. The logarithmic trend line was chosen as the most appropriate to describe the data points because a learning paradigm should be one in which the data quickly level off [23]. The R2 values range from 0 to 1 with 1 being close to the logarithmic trend line.
Immunohistochemistry
Immunohistochemistry (IHC) was performed on 5 μm thick, paraffin-embedded mouse brain tissue mounted onto slides. Slides were rehydrated with xylene, decreasing concentrations of ethanol, and deionized water. Antigen retrieval was performed by immersing the slides in a hot water bath at 98 degrees C incubated in a 1:10 Citrate Antigen Retrieval solution in autoclaved deionized water and cooled down to room temperature for 20 minutes. Slides were then stained using an avidin-biotin horseradish peroxidase (HRP) kit (anti-rabbit HRP-3,3’-Diaminobenzidine (DAB) Cell & Tissue Staining Kit, R&D Systems Minneapolis, MN) with manufacturer instructions slightly modified for best staining outcome. Slides were applied with a 3% peroxidase blocking reagent for 15 minutes to quench endogenous peroxidase activity which reduces background noise on the final stain result. Slides were washed in Tris-buffered saline, 0.1% Tween® 20 Detergent (TBST) solution for 5 minutes. To reduce non-specific hydrophobic interactions between the primary antibody and the tissue, a serum blocking reagent was placed onto each section for 15 minutes. After draining the serum off of the slides, avidin blocking reagent was placed onto them for 15 minutes followed by a rinse with TBST for 5 minutes. To prevent the binding of previously applied avidin, biotin blocking reagent was placed onto the slides for 15 minutes. The primary antibody in TBST at the following concentrations: histone deacetylase 2 (HDAC2)1/500 (ab7029, Abcam, Cambridge UK), brain-derived neurotrophic factor (BDNF) 1/500 (ab108319, Abcam, Cambridge UK), monocyte chemoattractant protein-1 (MCP-1) 1/200 (ab25124, Abcam, Cambridge UK), Synaptophysin 1/500 (ab32127, Abcam, Cambridge UK) was applied overnight in a humidified chamber. Slides were rinsed 3 times in TBST for 5 minutes each, then incubated with a biotinylated secondary antibody for 30 minutes and rinsed 3 times in TBST for 5 minutes each. Slides were incubated in High Sensitivity Streptavidin (HSS)-HRP for thirty minutes and rinsed in TBST 3 times for 2 minutes each. DAB Chromogen was applied to slides and incubated in the solution for 5 minutes each before rinsing with deionized water for 5 minutes. Slides were dehydrated in an increasing concentration of ethanol and xylene then mounted with a coverslip.
Imaging and QuPath analysis
IHC slides were photographed under a Nikon Eclipse
E400 microscope with a Nikon D7100 camera through a
microscope camera adaptor. All photos were taken under a
magnification of 4x so that the entire hippocampus could
be captured within each photo field. Photos were then uploaded onto a Google drive where slides were separated
into project files organized by staining group.
QuPath version v0.2.0-m11 was downloaded from Github
(https://QuPath.github.io/) [24]. When downloading,
QuPath allows the user to determine how much random
access memory (RAM) it will take up; so we determined
6 GB would be sufficient for the analysis of the project.
A new project was created on QuPath per each staining
group examined. This step was done to avoid having to
redo the steps of the project workflow for each image.
First, the image type was set to hematoxylin and 3,3’-Diaminobenzidine (H-DAB) in order for QuPath to recognize the images as a DAB Chromogen stain. The red,
green, and blue (RBG) values for DAB were then calibrated to better represent the project by selecting a region
of interest (ROI) that is representative of positive stains
along with the hippocampus. Smaller ROIs were used
that selected only the smaller areas of positive staining to
reduce any potential background noise. These ROIs were
then averaged to come up with a new RGB DAB value
for the project code. The hippocampus was then annotated
with the polygon wand to only measure staining at the desired region of the tissue. However, if there were any folds
or staining irregularities through a manual check, the slide
was omitted from the analysis. To quantify the staining,
superpixels were created to analyze the hippocampus [25].
Within the annotated hippocampus, QuPath groups similar
pixels into a cluster called a superpixel based on the RGB
values set for DAB. The pixel-based analysis was chosen
as the desired method of quantification because this study
is looking at multiple stains, and pixel analysis allows us
to follow an almost identical protocol between each group
[25]. Superpixel size was set to 25 µm2
in order to balance
capturing positively stained sections at a high resolution and processing speed. QuPath then applies a DAB
intensity to each of the superpixels previously set by the
initial DAB RGB calibrating. Not only does it process as
positive or negative, but it also separates the staining at
three levels of thresholds: 0.2, 0.4, and 0.6 or a positive
at all three levels. This, therefore, allowed the capture of
staining intensity across all positively stained cells in the
annotated region. In order to visualize the DAB staining
thresholds, a “heat map” was generated for each image
[25]. QuPath allows users to apply a gradient of color according to the quantifications of DAB staining generated
previously. The heat map allows a qualitative complement
of the previous analyses and serves useful in identifying
certain regions that have higher levels of staining. QuPath generates the heat map by assigning a color to each superpixel which indicates the different levels of DAB staining
based on the previously described thresholds. However,
the upper and lower bounds of the color spectrum must be
set by the user and made equal for each new project. This
way, the results within each project can be compared to
one another relative to staining distribution and intensity
across the hippocampus. It should be noted, however, that
the color is not indicative of positivity, but rather captures
the differences in intensity of the stain.
Statistics
Welch’s t-tests, Pearson Correlations, and graph creation were performed using Prism statistical software (Graphpad Software, La Jolla, CA, USA). The p-value was set for a statistical significance of p <0.05. All the data were presented as mean ± standard error of mean (SEM).
Results
The box maze grading platform separated slow learners from fast learners
Upon analyzing the 20 sleep deprived and 20 control mice
that were selected from the database of Box maze results,
we found n = 6 fast learners in the sleep deprived group
and n=15 fast learners in the control group (Figure 1).
Of a total of n = 40 middle-aged, C57BL/6 mice, n = 20
were exposed to short-term sleep deprivation whereas
n = 20 were a control group (non-sleep deprived). All
n = 40 were analyzed through the grading platform to
classify each mouse as either a fast learner or a slow
learner based on the R2
value. In the n=20 sleep deprived mice, n=6 were classified as sleep deprived, fast learners
whereas n=14 were sleep deprived, slow learners. In the
n=20 control mice, n=15 were classified as control fast
learners whereas n=5 were control, slow learners.
Plotting the raw escape latencies for each mouse produced
a graph that allowed the further distinction of fast and
slow learners through utilizing the coefficient of determination. Fast learners had a sharper and more consistent
decrease in latency time over the four trials when compared to slow learners, which can be better modeled with
a logarithmic trendline. Thus, fast learners had R2
values
that were close to 1 while slow learners had R2
values
close to 0. However, there were also mice with R2
values
that ranged somewhere in the middle. After finding the average R2
value across n=80 control mice, we set the fast
learner threshold value at greater than 0.74 (Figure 2).
The results from grading each mouse showed that among
the sleep deprived group, more mice had R2
values below
0.74 and were designated as slow learners. This meant
that fewer mice were able to perform well on the learning
assessment, presumably due to the synaptic impairment
known to occur with the loss of sleep [26]. As hypothesized, there was a smaller group of fast learners with R2
values above 0.74 within the sleep deprived group that
were able to maintain higher levels of cognitive functioning despite being exposed to sleep deprivation.
The R2 values obtained from the grading platform were
useful for comparing Box maze data of fast and slow
learners with other variables such as sleep deprivation
or staining intensity. Because raw Box maze data that is
plotted has many factors to account for, such as escape latency and the 4 trials per mouse, it is difficult to compare
to other factors. Therefore, the grading platform provides
additional value in that it is able to produce a single number to describe the learning curve across the four trials per
mouse (Figure 3).
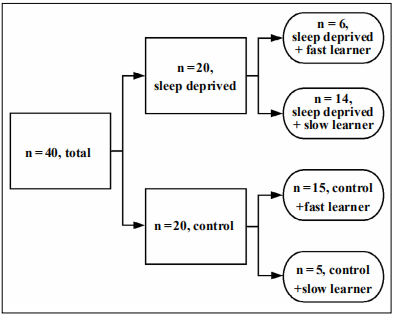
Figure 1. Grading platform separation data. Of a total of n = 40 middle aged, C57BL/6 mice, n = 20 were exposed to short term sleep deprivation whereas n = 20 were a control group (non-sleep deprived). All n=40 were analyzed through the grading platform to classify each mouse as either a fast learner or a slow learner based on the R2 value. In the n=20 sleep deprived mice, n=6 were classified as sleep deprived, fast learners whereas n= 14 were sleep deprived, slow learners. In the n=20 control mice, n=15 were classified as control fast learners whereas n=5 were control, slow learners.
Figure 2. Graph of raw escape latencies for fast and slow learners. Escape latencies for all n = 40 mice were plotted, and a logarithmic trendline was inserted. The R2 value was used to separate fast and slow learning mice. Mice with R2 values greater than 0.74 were deemed as fast learners, while mice with R2 values less than 0.74 were deemed as slow learners.
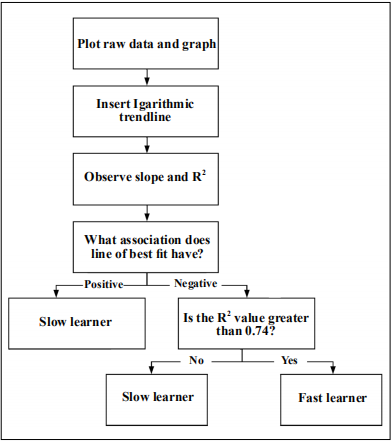
Figure 3. Visualization of the grading platform formatted as a flow chart. By starting from the square at the top and working down the flow chart each mouse was categorized as a slow or fast learner based on learning graph data. The total study population was n=40, and they were sorted as directed by the grading platform.
Hippocampal staining thresholds in sleep-deprived fastlearning mice were similar to that of nonsleep-deprived (control) fast-learning mice.
Slides that were stained through immunohistochemistry
and imaged were processed through the whole-image
analyzing software program, QuPath [24]. The results,
expressed in superpixels, showed that HDAC2, MCP-1,
Synaptophysin, and BDNF levels in sleep-deprived, fast learning mice were similar to that of the control, fast
learning mice. HDAC2 is a histone deacetylase complex
which indicates that some level of epigenetic alteration
is occurring. HDAC2 functions to repress transcriptional activity and therefore decreases the expression of
DNA products in the brain [27]. There are many types of
HDAC, but HDAC2 was of interest to our results because
it negatively regulates memory formation and synaptic
plasticity [28]. Sleep-deprived, fast learning mice had
significantly reduced levels of HDAC2 when compared to
that of slow learning mice (Figure 4B and C). MCP-1 levels were also significantly reduced in the sleep-deprived
fast-learning group which suggests that there was less
neuroinflammation occurring in the hippocampus of mice
that were graded as fast in their learning when exposed to
short-term sleep loss [29]. Synaptophysin and BDNF were
of interest to observe synaptic function and plasticity, respectively [30, 31]. Because levels of positive superpixels
among the sleep-deprived fast learners and control fast
learners were similar, these results showed that there are
characteristic levels of protein expression in fast learning
mice independent of sleep deprivation.
The independent t-tests performed also showed that the
control group (Figure 4A) is relevant because the statistics
are similar to the experimental group. We expected that a
portion of the control group should also be slow learners
to show the efficacy of the box maze and grading platform.
It also shows that the resiliency of the sleep-deprived fast
learners was significantly different from the slow learners.
Overall, the control group in our study showed similarity
to the experimental group in light of the sleep deprivation
that was given to the experimental group.
The heat map was able to visualize these results in a qualitative way to show that there were higher levels of super
positive pixels as indicated by a color gradient (Figure 5)
of red being high and blue being low. The heat map also
provided additional insight into the distribution of staining at different areas of the hippocampus. Overall, the
heat map served as a qualitative understanding of all four
strains that were tested through immunohistochemistry.
It complemented the superpixel positivity with a quick
visual understanding of what was being expressed by the
superpixel data.
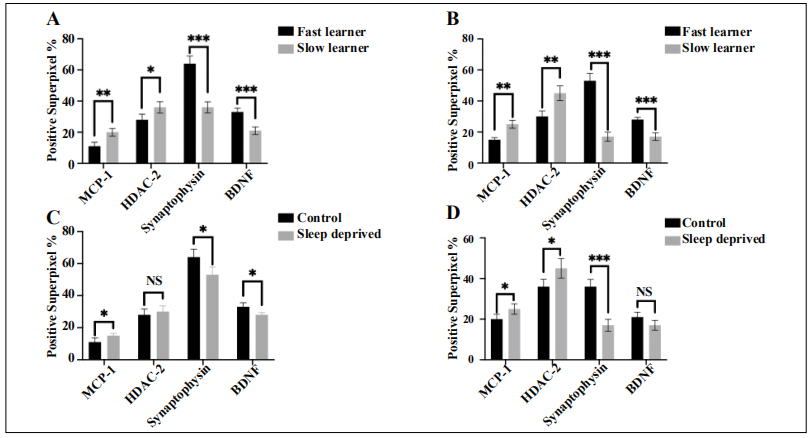
Figure 4. Positive Superpixel percentage in the hippocampus when stained with MCP-1, HDAC2, synaptophysin, and BDNF. (A) control mice, (B) sleep deprived mice, (C) fast learners, (D) slow learners. *Significant by Welch’s T-Test of control to sleep deprived groups in light of fast and slow learners (A, B) then fast to slow learners in regards to control and sleep deprived mice (C, D).
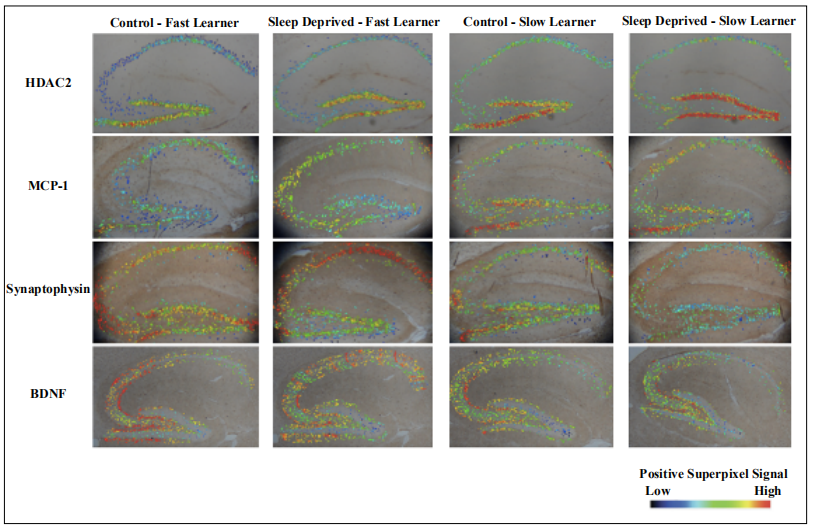
Figure 5. Sagittal hippocampal sections were imaged at 40x and analyzed using QuPath. Visual representation of positive superpixels using a heat map. Rows represent staining groups while columns show graded groups for control or sleep-deprived mice. Staining intensity is based on a positive superpixel signal with dark blue suggesting lower levels, green being moderate, and red as high. The rows with HDAC2 and MCP-1 show that fast learners had higher amounts of blue signal whereas slow learners showed redder. The rows with Synaptophysin and BDNF showed that fast learners had higher amounts of red signal whereas slow learners showed more blue and green. Adapted in part from Lee et al [32].
Learning ability in sleep-deprived fast learners showed a correlation suggestive of a decrease in hippocampal mediated molecular neuropathology.
The superpixel positivity generated from QuPath was graphed against the R2 values obtained from the box maze grading to determine the relationship between escape latency and hippocampal protein expression. Using the Pearson Correlation coefficient and p-value, each staining group was compared to the total percentage of positive superpixels. MCP-1 had a negative Pearson Coefficient of -0.90 and a p value of <0.0001 (Figure 6A) which indicates that there is a strong negative correlation with superpixel positivity as the R2 value increases. This is suggestive of lower inflammation levels in mice that were faster in learning the maze. HDAC2 also had a negative Pearson Coefficient value of -0.84 and a p value of <0.0001 (Figure 6B) which indicates a strong negative correlation of superpixel positivity with decreasing R2 value. Since HDAC2 is a deacetylase complex, this association is suggestive of higher levels of transcriptional repression in DNA products that ultimately impaired learning in mice. Synaptic markers BDNF and Synaptophysin have opposite results in that both showed a strong statistically significant positive correlation in superpixel positivity and R2 value (Figure 6C and D). BDNF has a Pearson coefficient of 0.91 and a p value of <0.0001 which shows that synaptic plasticity according to positive superpixel was increased in fast learning mice. Synaptophysin also showed similar results, as it had a Pearson coefficient of 0.97 and was statistically significant with a p-value of < 0.0001. This is indicative of increased synaptic plasticity according to positive superpixel values in mice that are faster learners. The correlations for all listed stains were statistically significant as indicated by their p-values. Direct comparison of individual escape latency values with the individual QuPath superpixel positivity percentage shows that the box maze grading platform and the immunohistochemistry data are consistent with each other. This comparison reveals that fast learners in the maze generally exhibit lower levels of inflammation and histone deacetylation, while synaptic plasticity and function are increased. These results, therefore, offer a statistically significant and novel way to measure levels of neural molecules in mice after being run through the box maze. These escape latencies can then easily be compared with QuPath positive superpixels as a quick way of investigating molecular pathways of learning impairment in the hippocampus.
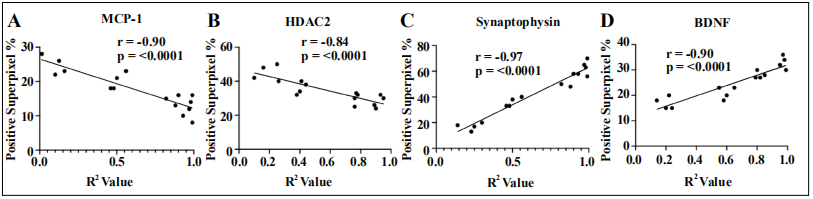
Figure 6. Positive superpixel percentage in each stain compared to the learning curve expressed by the R2 value in each mouse. Pearson’s correlation on (A) MCP-1 and (B) HDAC2 show a statistically significant negative correlation while (C) Synaptophysin and (D) BDNF show a sttistically significant positive correlation.
Discussion
The grading platform for learning in mice is an effective way to separate slow from fast learners in the spatial
navigation Box maze. With the R2
threshold set at 0.74
through averaging the escape latencies of n = 80 control
mice, results of the grading platform produce a single
value that can easily be compared to numbers of other
variables of interest. Ultimately, the grading gives an R2
value that captures the totality of the Box maze results
(escape latency for four trials) for each individual mouse.
This platform is also effective in separating fast and slow learning mice in both short term sleep deprived and control populations that were run through the Box maze.
Through this analysis, we found that n = 6 mice out of
n=20 that were sleep deprived were graded as fast learners in the platform. Control mice, as expected, had results
that showed a higher proportion of fast learners n=15 to
slow learners n=5.
The results from the grading platform indicate that the
separation process yields expected results that can then
be used for further investigation of different processes.
Through utilizing immunohistochemistry, the results have
shown that the grading platform in combination with the
short-term sleep deprivation Box maze protocol produces
results that are suggestive of a hippocampal learning
impairment in slow learning mice. These results can be
quickly visualized through a QuPath heat map that shows
a difference in superpixel positivity among the different
staining groups generated through the grading platform.
Although the exact neural mechanisms of sleep deprivation were not investigated in this project, the heat map of
the immunohistochemistry stains provides evidence of
positive staining in regard to location and intensity based
on the novel idea of super pixels through QuPath, and
provides a glimpse of the molecular pathway involved.
QuPath is a new software so there is still much to be explored and refined with analyzing protocols. Currently,
a PubMed search only brings up a total of 22 papers in
total that have used this program to analyze whole image
slides. Additionally, because QuPath is only an analyzing
software, it is critical that immunohistochemistry protocols be performed in a uniform and consistent manner [32].
This would require careful planning of tissue harvesting,
sectioning, and imaging that would allow for the best results. Further molecular analysis should be performed to
confirm the QuPath data so that conclusions can be drawn
on the molecular pathway associated with hippocampal
learning impairment observed in sleep deprived mice.
QuPath was able to show a significant correlation between
positive super pixels and box maze learning times through
the R2
value. These observations are therefore a valuable
insight into utilizing the Box maze learning classification of slow or fast learners in future studies looking into
resilience to environmental stressors of sleep deprivation.
QuPath can also be used as a novel application to study
correlations between positive super pixels in immunohistochemistry slides from a variety of different protocols
and tissues.
We looked at four antibodies in this study: MCP-1,
HDAC2, Synaptophysin, and BDNF. Through QuPath
analysis, we found that levels of MCP-1 and HDAC increase, while levels of Synaptophysin and BDNF decrease
as learning latency increases. Future studies to determine
if specific genes were over or underregulated to cause
these differences could help elucidate the genetic pathways involved in resilience. Furthermore, it would be interesting to see if there were some genetic differences between slow and fast learning mice that predisposed them
to learning at their respective speeds. This could shed light on genetic predisposition to resilience and point to targets
that could be studied in humans.
The model of short-term sleep deprivation in middle age
is translationally relevant because older adults are observed to have reduced sleep according to electroencephalography (EEG) data in comparison to younger adults
[33]. Mice 16-18 months old represent the general human
population in their late 50’s and early 60’s [34]. This is an
important age group to study resilience, as cognitive decline is often seen shortly after midlife and occurs noticeably at ages 70 or higher [35]. Our study found significant
differences in four protein levels between fast and slow
learning mice. The data generated in this study suggest
that mice can be used as models for sleep deprivation and
resilience and offer valuable insight on the importance of
intervention to attenuate the impacts of cognitive decline
that is often observed in the older population.
Declarations
Financial supports
This work was supported by the National Institute on Aging (grant number R01 AG057381, W Ladiges, PI).
Conflict of interest
The authors declare no conflict of interests.
References
1. Stephens M A C, Wand G. Stress and the HPA axi: Role of glucocorticoids in alcohol dependence. Alcohol research: current reviews, 2012.
2. Faye C, McGowan J C, Denny C A, et al. Neurobiological mechanisms of stress resilience and implications for the aged population. Current neuropharmacology, 2018, 16(3): 234-270.
3. Sampedro-Piquero P, Alvarez-Suarez P, Begega A. Coping with stress during aging: the importance of a resilient brain. Current neuropharmacology, 2018, 16(3): 284- 296.
4. Anderson L A, Goodman R A, Holtzman D, et al. Aging in the United States: opportunities and challenges for public health. 2012.
5. Lima M G, Barros M B A, César C L G, et al. Health related quality of life among the elderly: a population-based study using SF-36 survey. Cadernos de saude publica, 2009, 25(10): 2159-2167.
6. Jeste D V, Savla G N, Thompson W K, et al. Association between older age and more successful aging: critical role of resilience and depression. American Journal of Psychiatry, 2013, 170(2): 188-196.
7. Frau R, Traccis F, Bortolato M. Neurobehavioural complications of sleep deprivation: Shedding light on the emerging role of neuroactive steroids. Journal of Neuroendocrinology, 2020, 32(1): e12792.
8. Hirshkowitz M, Whiton K, Albert S M, et al. National Sleep Foundation’s sleep time duration recommendations: methodology and results summary. Sleep health, 2015, 1(1): 40-43.
9. Consensus Conference Panel, Watson N F, Badr M S, et al. Joint consensus statement of the American Academy of Sleep Medicine and Sleep Research Society on the recommended amount of sleep for a healthy adult: methodology and discussion. Sleep, 2015, 38(8): 1161-1183.
10. National Center for Health Statistics. QuickStats: Percentage of adults who reported an average of≤ 6 hours of sleep per 24-hour period, by sex and age group-United States, 1985 and 2004. MMWR Morb Mortal Wkly Rep, 2005, 54(37): 933.
11. Ferrie J E, Kumari M, Salo P, et al. Sleep epidemiology—a rapidly growing field. 2011.
12. Centers for Disease Control and Prevention (CDC. Short sleep duration among workers--United States, 2010. MMWR. Morbidity and mortality weekly report, 2012, 61(16): 281.
13. Goel N, Dinges D F. Behavioral and genetic markers of sleepiness. Journal of Clinical Sleep Medicine, 2011, 7(5 Suppl): S19-S21.
14. Van Dongen H, Maislin G, Dinges D F. Dealing with interindividual differences in the temporal dynamics of fatigue and performance: importance and techniques. Aviation, space, and environmental medicine, 2004, 75(3): A147-A154.
15. Dennis L E, Wohl R J, Selame L A, et al. Healthy adults display long-term trait-like neurobehavioral resilience and vulnerability to sleep loss. Scientific Reports, 2017, 7(1): 1-10.
16. Goel N, Dinges D F. Predicting risk in space: genetic markers for differential vulnerability to sleep restriction. Acta astronautica, 2012, 77: 207-213.
17. Goel N, Basner M, Rao H, et al. Circadian rhythms, sleep deprivation, and human performance//Progress in molecular biology and translational science. Academic Press, 2013, 119: 155-190.
18. Basheer R, Brown R, Ramesh V, et al. Sleep deprivationinduced protein changes in basal forebrain: Implications for synaptic plasticity. Journal of neuroscience research, 2005, 82(5): 650-658.
19. Darvas M, Mukherjee K, Lee A, et al. A Novel One-Day Learning Procedure for Mice. Current Protocols in Mouse Biology, 2020, 10(1): e68.
20. Taishi P, Sanchez C, Wang Y, et al. Conditions that affect sleep alter the expression of molecules associated with synaptic plasticity. American Journal of Physiology-Regulatory, Integrative and Comparative Physiology, 2001, 281(3): R839-R845.
21. Kraeuter A K, Guest P C, Sarnyai Z. The Y-Maze for assessment of spatial working and reference memory in mice//Pre-Clinical Models. Humana Press, New York, NY, 2019: 105-111.
22. Colavito V, Fabene P F, Grassi Zucconi G, et al. Experimental sleep deprivation as a tool to test memory deficits in rodents. Frontiers in systems neuroscience, 2013, 7: 106.
23. Roediger H L, Smith M A. The “pure-study” learning curve: The learning curve without cumulative testing. Memory & cognition, 2012, 40(7): 989-1002.
24. Bankhead P, Loughrey M B, Fernández J A, et al. QuPath: Open source software for digital pathology image analysis. Scientific reports, 2017, 7(1): 1-7.
25. Morriss N J, Conley G M, Ospina S M, et al. Automated Quantification of Immunohistochemical Staining of Large Animal Brain Tissue Using QuPath Software. Neuroscience, 2020, 429: 235-244.
26. Manchanda S, Singh H, Kaur T, et al. Low-grade neuroinflammation due to chronic sleep deprivation results in anxiety and learning and memory impairments. Molecular and cellular biochemistry, 2018, 449(1-2): 63-72.
27. Guan J S, Haggarty S J, Giacometti E, et al. HDAC2 negatively regulates memory formation and synaptic plasticity[J]. Nature, 2009, 459(7243): 55-60.
28. Chouliaras L, LA van den Hove D, Kenis G, et al. Histone deacetylase 2 in the mouse hippocampus: attenuation of age-related increase by caloric restriction. Current Alzheimer Research, 2013, 10(8): 868-876.
29. Bettcher B M, Neuhaus J, Wynn M J, et al. Increases in a pro-inflammatory chemokine, MCP-1, are related to decreases in memory over time. Frontiers in aging neuroscience, 2019, 11: 25.
30. Calhoun M E, Kurth D, Phinney A L, et al. Hippocampal neuron and synaptophysin-positive bouton number in aging C57BL/6 mice. Neurobiology of aging, 1998, 19(6): 599-606.
31. Heldt S A, Stanek L, Chhatwal J P, et al. Hippocampusspecific deletion of BDNF in adult mice impairs spatial memory and extinction of aversive memories. Molecular psychiatry, 2007, 12(7): 656-670.
32. Lee A, Jiang Z, Zhu L, et al. QuPath. A new digital imaging tool for geropathology. Aging Pathobiology and Therapeutics, 2020, 2(2): 114-116.
33. Landolt H P, Borbély A A. Age-dependent changes in sleep EEG topography. Clinical Neurophysiology, 2001, 112(2): 369-377.
34. Dutta S, Sengupta P. Men and mice: relating their ages. Life sciences, 2016, 152: 244-248.
35. Salthouse T A. When does age-related cognitive decline begin? Neurobiology of aging, 2009, 30(4): 507-514.