Open Access | Research Article
This work is licensed under a Creative
Commons Attribution-ShareAlike 4.0 International License.
PathoClock and PhysioClock in mice recapitulate human multimorbidity and heterogeneous aging
* Corresponding author: Warren Ladiges
Mailing address: Department of Comparative Medicine, School
of Medicine, University of Washington, Seattle, WA 98195,
USA.
Email: wladiges@uw.edu
* Corresponding author: Shabnam Salimi
Mailing address: Department of Epidemiology and Public
Health, University of Maryland Baltimore, School of Medicine,
Baltimore, MD, USA.
Email: shabnam.salimi.m.d@gmail.com
Received: 19 October 2021 / Accepted: 23 December 2021
DOI: 10.31491/APT.2021.12.074
Abstract
Background: Multimorbidity is a public health concern and an essential component of aging and
healthspan
but understudied because investigative tools are lacking that can be translatable to capture similarities and
differences of the aging process across species and variability between individuals and individual organs.
Methods: To help address this need, body organ disease number (BODN) borrowed from human studies
was applied to C57BL/6 (B6) and CB6F1 mouse strains at 8, 16, 24, and 32 months of age, as a measure of systems
morbidity based on pathology lesions to develop a mouse PathoClock resembling clinically-based Body Clock
in humans, using Bayesian inference. A mouse PhysioClock was also developed based on measures of physiological
domains including cardiovascular, neuromuscular, and cognitive function in the same two mouse
strains so that alignment with BODN was predictable.
Results: Between- and within-age variabilities in PathoClock and PhysioClock, as well as
between-strain variabilities.
Both PathoClock and PhysioClock correlated with chronological age more strongly in CB6F1 than
C57BL/6. Prediction models were then developed, designated as PathoAge and PhysioAge, using regression
models of pathology and physiology measures on chronological age. PathoAge better predicted chronological
age than PhysioAge as the predicted chronological and observed chronological age for PhysioAge were complex
rather than linear.
Conclusion: PathoClock and PhathoAge can be used to capture biological changes that predict BODN,
a metric
developed in humans, and compare multimorbidity across species. These mouse clocks are potential translational
tools that could be used in aging intervention studies.
Keywords
Multimorbidity, aging, pathology, physiology, pathoClock, physioClock, pathoAge, physioAge
Introduction
An increase in the population of older adults comes with a
rise in age-related health conditions [1]. With the increase in lifespan in the population, healthspan has become a
focus of research and public health policies [2, 3]. Therefore, measurements of healthspan require cross-species
translatable tools for preclinical and clinical studies [4-6]. For
example, with distinct frailty indices in humans,
mouse models of frailty have been developed [7-9]. Recent
studies of age-related pathology using a geropathology
platform that generates age-related lesion scores [10]
have suggested a stronger correlation between age-related
pathologies and chronological age than frailty indices [5,
10, 11].
A crucial aspect of healthspan is the burden of multimorbidity,
conventionally described as having two or more
diseases [2]. While comorbidity is commonly used to
assess clinical disease burden in people, especially with increasing age, it has not been well characterized in animal
models in a manner that has significant translational
relevance.
Studies of rodent models have extensively focused on
lifespan, using either chronological age or time to death as
outcomes [12-14]. In recent years, healthspan has become
an increasingly important focus of research with an increase
in the older population [11, 15]. Multimorbidity is
one of the crucial aspects of healthspan [4], but the study
of multimorbidity in mammalian models has been limited.
Most studies have used a frailty index (FI) of one kind or
another as a translatable tool to report health in humans or
mice. Previously, FIs were adapted to apply to C57BL/6
mice [8], and a study of C57BL/6 showed that FI scores
were related to heart hypertrophy [9]. However, the disease
status of organs with morbidity and the histopathological
changes associated with specific organs were not
studied. In addition, whether the physiological changes
tracked with end-point pathologies was not reported.
Moreover, human FIs usually incorporate the disability
state into the score, skewing the measures toward those
with a disability rather than predicting disability as one
possible deteriorating outcome prior to mortality [7].
One approach to better define comorbidity in animal models
is to consider the presence of pathology at the organ
level. While many studies have focused on how aging
and age-related diseases affect individual organs, each
organ's contribution to overall aging has been overlooked.
A recent study of multimorbidity in the human population
has suggested body organ disease number (BODN) as an
index of multimorbidity [16]. The disease levels of each
organ are heterogeneously incorporated into BODN at the
individual level. The integrated burden of disease incorporated
into BODN for an individual has been shown to
outperform chronological age to predict BODN and has
been termed Body Clock [16].
Therefore, it is speculated that an organ-based pathology
system in aging mice, such as the recently developed geropathology
grading platform [10] could be used to define
a measurable phenotype designated as PathoClock. By
applying the Bayesian inference [9], the mouse-specific
PathoClock could be a useful tool to simulate the human
Body Clock. In addition, physiological and functional
measurements are routinely determined in aging mouse
studies. Therefore, this type of preclinical data could
be used to predict heterogeneous BODN resulting in a
mouse-specific PhysioClock.
Some studies of aging have used biological measures tied
to chronological age as outcome to predict biological age
[12]. The current manuscript introduces PathoAge and
PhysioAge using Bayesian inference and regression models
of pathology and physiology measures, respectively,
to understand how pathology and physiology based on
chronological age align with biological age.
Methods
Mice and study design
CB6F1 and C57BL/6 male mice were obtained from the National Institute on Aging (NIA) aged rodent facility (Charles River @ Laboratories) and housed in a specific pathogen-free facility at the University of Washington (UW) School of Medicine. Standard care procedures were followed including rodent chow, reverse osmosis purified automatic watering, 12: 12 light cycle, and 72 ± 2 degrees F room temperature. All animal protocols were approved by the UW Institutional Animal Care and Use Committee. Animals were euthanized for pathology studies at ages 8, 16, 24, and 32 months, three months after the physiological domains were measured.
Physiological assessment
(1) Cardiac function. Echocardiography was used to assess
systolic and diastolic function in mice. The Siemens
Acuson CV-70 system using standard imaging planes: Mmode,
conventional, and Tissue Doppler imaging, was
used to measure cardiac function, including the ratio of
the aorta and left atrium (AO/LA ratio), ejection time (ET
msec), isovolumic contractile time (IVCT msec), isovolumic
relaxation time (IVRT msec). The E/A ratio as a
marker of the left ventricle function indicates the peak velocity
blood flow from left ventricular relaxation in early
diastole (the E wave) to peak velocity flow in late diastole
caused by atrial contraction (the A wave). Myocardial
performance index (MPI) incorporates both systolic and
diastolic time intervals in expressing a global systolic and
diastolic ventricular function quantified as MPI = (IVCT +
IVRT)/ET [17]. The methods are described elsewhere [18].
Neuromuscular Function. Established tests of muscular
activity were used to assess changes in muscle strength
and coordination with age. Several assessments including
coordinated walking ability, grip strength, novel environment
response, and self-motivated running, were used to
address variability due to motivation, emotionality, or sensory
deficits.
(2) Coordinated walking ability. Coordinated walking
ability was assessed using a rotarod apparatus (Rotamax
4/8, Columbus Instruments, Inc.) that tested the ability of
the mouse to maintain walking speeds on a rotating rod.
Mice were placed in the lanes of the rotarod with the initial
rod speed set at 0 RPM. The speed was progressively
increased by 0.1 RPM/sec (0 to 40 RPM over 5 minutes)
until all mice had been dislodged as determined by an
infrared sensor. The time in seconds was recorded. Three
successive runs were performed per day for three days.
Therefore, there is an evaluation of motor function and
performance learning. The assay was performed by the
same person, at the same location. Data are reported as the
median of 3 trials and standardized by body weight.
(3) Grip strength. Forelimb grip strength was
analyzed
using a force tension apparatus (San Diego Instruments
Columbus Instruments, Inc.). Prior to the test, each mouse
was weighed to the nearest 0.1 g. Once mice gripped the
stationary bar with their forepaws, they were stretched
horizontally while held at the base of their tails. Mice
were pulled gradually until they let go of the bar. The process
was repeated 5 times to determine the peak grip force
value (gram-force) standardized to body weight [19].
(4) Novel
environment response. Mice were assessed for
movement levels in a novel cage environment using an
open field photobeam apparatus (Photo beam Activity
System, Columbus Instruments, Inc.). Each mouse was
placed for five minutes in a clear, rectangular, plastic container
the size of a standard mouse cage, which had a rectangular
grid of infra-red beams inside, three on the X-axis
and four on the Y-axis to measure horizontal movement
(lateral activity). Another grid set of beams were positioned
above the lower set to measure vertical movement
(rearing). Beam breaks were counted for activity and rearing
and further classified for either the central or peripheral
part of the box as a measure of anxiety. The activity
was assessed for a five-minute period on three consecutive
days [20].
(5) Self-motivated running. The self-motivated running
distance was measured by a voluntary wheel running apparatus
over three days as described by Goh and Ladiges
(2015) [21]. Mice were placed into a standard cage with
a slanted plastic saucer-shaped wheel (Med Associates,
Inc.). Mice were acclimated to the cage for 48 hours with
the wheel locked, after which the wheels were unlocked
and the distance each mouse ran was tracked by a computer
over 72 hours including both light and dark cycles.
Total distance in kilometers was recorded.
(6) Cognitive Function. Cognition was assessed using
the radial water tread (RWT) maze, an assay used to assess
memory as previously described [22, 23]. The RWT
detects changes in hippocampal function in mice. Briefly,
mice are introduced into an approximately 30-inch circular
galvanized enclosure with waste-deep water and
peripheral escape holes in the sides at regular intervals, all
closed except one which leads to a dark “safe box” with a
heating pad. The inside walls contain spatial cues for the
animal to find the escape route with repeated trials. The
animals were given three trials per training day, and the
testing period ran across successive days to test long-term
memory acquisition. Performance was recorded by direct
observation [24].
Various physiological domains described above were used
to predict body organ disease number (BODN) and define
a mouse-specific PhysioClock independent of chronological
age.
Pathological assessments
Cataract assessment. The presence and severity of cataracts
were assessed by slit-lamp ophthalmoscopy on
unanesthetized mice after dilation with a 3: 1 volume
mixture, respectively, of tropicamide and phenyl hydrochloride
to achieve full dilation. The degree of lens opacity
was rated by half steps from 0 (completely clear) to
4 (complete opacity of a mature cataract) as previously
described [25].
Histopathology assessment. Histopathology
assessments
were performed on Hematoxylin and Eosin-stained 4-micron
tissue sections from heart, kidney, liver, pancreas,
muscle, lung, and brain as previously described [10].
Age-related lesion severity levels were determined by a scoring system from 0 (no lesion present) to a range
of 1
to 4 (lesion presence and severity). The absence or presence
and severity of age-related lesions were then used to
determine organ morbidity defined as the presence of twolevel
1 lesions or one lesion with a score of 2 or greater.
The body organ disease number (BODN) was then calculated
as the number of organ systems with morbidity as
a proxy of multimorbidity and a counterpart of clinically
determined BODN in humans. With the premise that different
pathology entity levels incorporate into BODN heterogeneously,
all organ pathologies in a model were used
to predict BODN for each mouse to quantify PathoClock
independent of chronological age.
Statistical analyses
BODN was considered an ordinal outcome as a number of
organ systems with at least two positive pathology criteria
at level 1 or at least one pathology at level 2 or more. We
recorded the levels starting from 1 as an ordinal value.
Bayesian inference was used for ordinal outcome [26]
also ordinal [27], binary, or continuous predictors depending
on the type of predictor variables [27-30]. Bayesian
inference approach was used comprising two components:
1) Prior knowledge on the estimates (parameters), as the
information before observing the data P (ϴ) where ϴ indicates
the parameters; and 2) the likelihood P (Y|ϴ) of the
information contained in the data (Y). Using the Bayes
formula, the posterior distribution of the parameters P
(ϴ|Y) was obtained, which can be updated when encountering
new data [28].
Applying the conditional probability given the known
data on BODN, the Bayesian inference framework yields
the posterior density of beta estimate coefficients and 95%
credible interval (CI) that each pathology level incorporates
into BODN, or each physiological measure predicts
BODN. For each coefficient parameter, we determined the
distributions of their prior parameters using weak priors
[28]. For the classes of beta coefficients and intercept, the
prior estimate with a normal distribution (mean: μ = 0,
variance σ = 10), and for the class standard deviation (sd)
which indicated the variation of levels related to varying
age, the half-Cauchy (0,10) was used. The uniform prior
with a Dirichlet distribution was used for ordinal predictors
[i.e., (2, 2) for ζ1 and ζ2 (simplex parameters) for a
three-level pathology predictor]. We reported the standard
deviation for the model level in multilevel analyses (sd),
and sigma which is the variance of a continuous outcome
in the model with a gaussian family [27, 30]. Posterior
predict function was then used in the Bayesian framework
[28, 30] to predict
individual-based BODN for each
mouse using all organ pathology levels, termed Patho-
Clock. The correlation of PathoClock and chronological
age was quantified as a rate of pathology-based biological
age.
The model accuracy was assessed with Leave-One-
Out Cross-Validation (LOO-CV) (k
< 0.7) which with a Pareto-smoothed importance sampling diagnostic k < 0.7 indicating the LOO-CV computation
is reliable and there are no outlier observations. Also, a Bayesian inference approach called “stacking”
determines model weights for each model to predict an outcome [29,
31]. The Leave- One-Out R squared
(LOO_R2) was used to determine the R2 of the model to show how a model explains the outcome [32].
All
statistical analyses were performed using the Bayesian “brms” software package [30]. A
dynamic Hamiltonian Markov chain Monte Carlo (MCMC) algorithm [30,
33] was used to obtain posterior draws
using a minimum of six chains and a minimum of 10,000 iterations. Model averaging was then used in the
Bayesian framework, called stacking, which provides weight for the best model predicting BODN [34]. For
pathologies of more than two levels, we used the “monotonic” effect implemented in the Bayesian inference
framework which defines the probability of coefficient estimates with Dirichlet distribution [27]. The
physiological measures like grip strength or rotarod, which have an inverse association with BODN, were
transformed so that were multiplied by -1 to develop PhysioClock.
Commonly, studies statistically have
regressed biomarkers or phenotype measurements on chronological age to assess how they predict chronological
age [12]. In concert with such an approach, we developed PhysioAge
and PathoAge, regressing the allocated
physiological measures and pathological level measurements, respectively, on chronological age using a gamma
distribution. In CB6F1, to develop PhysioAge, we included normalized grip strength, rotarod test at day 3,
open field activity at day3, open field rearing at day 2, distance, AO/LA ratio, ET (ejection time), LVM,
MPI, and Maze test at day 5. In C57BL/6, for PhysioAge we included nine physiologic measures including AO,
LA, natural log-transformed E/ A ratio, LVMI and MPI, Maze test at day 5, open field activity at day 1,
rotarod at day 2, and normalized grip strength.
Results
Physiological performance predicts body organ disease number
Cardiac function. Echocardiography was used to measure
cardiac function. For CB6F1, the ratio of aortic valve diameter
to left atrium dimension (AO/LA) was inversely
associated with increase in BODN (beta = -2.3, 95% CI:
-4.3 to -0.32), E to A waves ratio (beta = -1.5, 95% CI:
-2.9 to -0.15), on natural logarithm scales and with relatively
high uncertainty (wide credible interval CI) isovolumic
contraction time (IVCT) [beta = 1.48, 95% CI:
0.02-3.0], left ventricular internal diameter end diastolic
(LVIDd) [beta = 7.6, 95% CI: 0.13 = 15.0], left ventricular
internal diameter end systolic (LVIDs) (beta = 4.7, 95%
CI: 0.47-9.03), (considering both systolic and diastolic
measures (MPI) [beta = 2.03, 95% CI = 0.11-4.01], ejection
time (beta = - 6.6, 95% CI: -12.0 to -0.7) predicted
BODN (Figure 1A, Table
1A). Chronological age per se was strongly associated with BODN (beta = 0.34, 95% CI
= 0.24-0.46) while stacking of the cardiovascular models
predicting BODN revealed cardiovascular physiologies
predict BODN stronger than chronological age predicted
BODN so that the model weight for chronological age
turned to zero. The largest model weights were allocated
to ejection time (ET: 27.5%), E/A ratio (26%), IVCT
(21.5%), MPI (17%), AO/LA ratio (8%) that MPI by 46%,
LVIDd by 19%, E/A ratio by 28.5%, IVCT (6%) with the
rest also turned to zero.
For C57BL/6 mice, aortic valve diameter (beta = 2.3, 95%
CI: 0.6-4.0), LA (beta = 1.65, 95% CI: 0.13-3.28), IVCT
(beta = -1.79, 95% CI: -0.35 to -0.14), LVIDs (beta = 4.1,
95% CI: 0.69-7.8) were significantly predicted BODN.
With wide uncertainty (credible interval including zero)
both AO/LA ratio and E/A ratio were inversely predicted
BODN.
Using model averaging overall physiological measures of
the cardiovascular system in C57BL/6 showed that MPI
by 72.6%, LVIDs by 22%, E/A ratio by 0.5%, aortic diameter
(mm) by 1 %, and left atrial diameter (mm) by 4.5
% predicted BODN and were included in the final model
as cardiovascular physiology domains to quantify Physio-
Clock.
Neuromuscular Function. Rotarod test for CB6F1 indicating
disturbed balance state predicted increase in BODN
measured at day 2 (beta = -1.7, 95% CI: -2.86 to -0.62).
Stacking of the models showed that the model assessed
balance state at day 2 weighed 75.4% to predict BODN
compared to day 1 (17.1%) and day 3 (7.5%). Therefore,
we included rotarod test day 2 in the PhysioClock model.
The lower the grip strength, the larger the BODN was
(beta = -5.9, 95% CI: -10.5 to -1.6), and it was more robust
when normalized to body mass (beta = -7.3, 95% CI:
-11.4 to -3.8). Comparing models showed that the normalized
grip strength over body size was a stronger predictor
of BODN at 98.3%.
For C57BL/6 mice, balance states at days 1 and 2 significantly
predicted BODN with day -2 model weight (53.2%)
larger than day 1 (46.8%). Therefore day 2 was included
in the Physiology Clock. Like CB6F1, the grip strength
in C57BL/6 normalized over body mass was a stronger
predictor of BODN (Figure 1B, Table 1B). In this strain,
only grip strength normalized by body mass significantly
predicted BODN with credible intervals excluding zero.
However, wide CI (beta = -3.2, 95% CI = -6.4 to -0.18)
showed some degree of uncertainty.
Cognitive Function. For CB6F1 mice, time of learning
maze measured at day 1, 2 ,3 and 4 was associated with
increased in PathoClock (day 1: beta = 1.13, 95% CI =
0.18-2.07; day 2: beta = 0.87, 95% CI = 0.21-1.54; day 4:
beta = 0.45, 95% CI = 0.11-0.78). The longer the learning
process at day 1 the larger the PathoClock was. The longer
maze test indicated poorer cognition and predicted larger
PathoClock (day 5: beta = 0.49, 95% CI = 0.15-0.83; day
12: beta = 0.92, 95% CI: 0.49-1.38). Likewise, results
were detected for observed BODN (day 2: beta = 1.5, 95%
CI: 0.22-2.79; day 4: beta = 0.62, 95% CI: 00.08-1.18) and this association was stronger at day 2. Also,
cognitive
decline was associated with an increase in BODN so
that the maze test results at day 5 (beta=0.94, 95% CI=
0.35-1.53) and 12 were strongly predictive of BODN
(beta=0.92, 95%CI:0.49-1.38). The model stacking over
the models including learning stages showed learning
stage at day 1 (weight 62.8%) was a stronger predictor of
BODN, and the cognition test at day 5 was stronger than
day 12 (weight by 98.6%). Stacking over the learning and
cognition test stage models showed that day 1 and day 5
weighed more than other days (model weights for day 1:
19.6%, and day 5: 78.9%). We included these two measures
of learning and cognition in the PhysioClock model
for CB6F1.
For C57BL/6 mice among learning and cognitive stages
of the RWT maze test, day 1 and day 5 were the more
robust predictors of BODN with model weights 61.5%
and 99%, respectively. However, overall, the maze test
in C57BL/6 was less predictive of BODN compared to
CB6F1, but we included the day 5 maze test as it carried a
larger weight to predict BODN.
Open field physical activity, rearing, and wheel running
distance. For CB6F1 mice, open field physical activity
indicated physical aptitude at day 3 significantly and
inversely predicted BODN (beta = -1.7, 95% CI: -3.4 to
-0.03). The higher rearing in physical activity, the larger
the BODN was with a larger estimate at day 1 (beta = 1.49,
95% CI: 0.44-2.59). However, the model weight favored
the rearing activity at day 2 in prediction BODN weighed
by 77.2% compared to day 1 (22.8%). We included day
2 rearing activity in the final model determining Physio-
Clock. The mice with lower running distance had larger
system morbidity measured by BODN (beta = -0.6, 95%
CI: -0.98 to -0.3).
For C57BL/6 mice, open field physical activity was not
significantly predictive of BODN. Stacking the models
showed day 1 open field activity model weight was
79.8%. Also, the rearing activity model at day 1 with
57.4% weight explained BODN better than day 2 and 3.
The total distance for the running wheel was inversely associated
with BODN yet with a broad uncertainty (beta
= -0.11, 95% CI = -0.46 to 0.23). We only included total
distance in the final model to quantify PhysioClock.
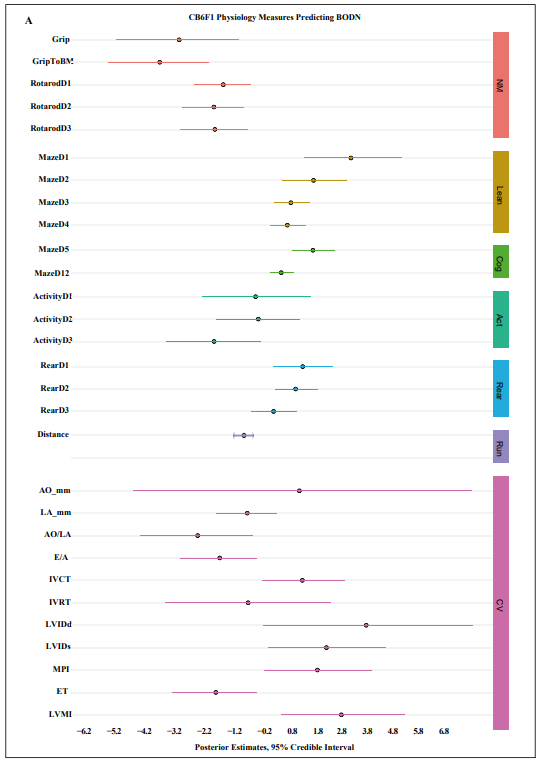
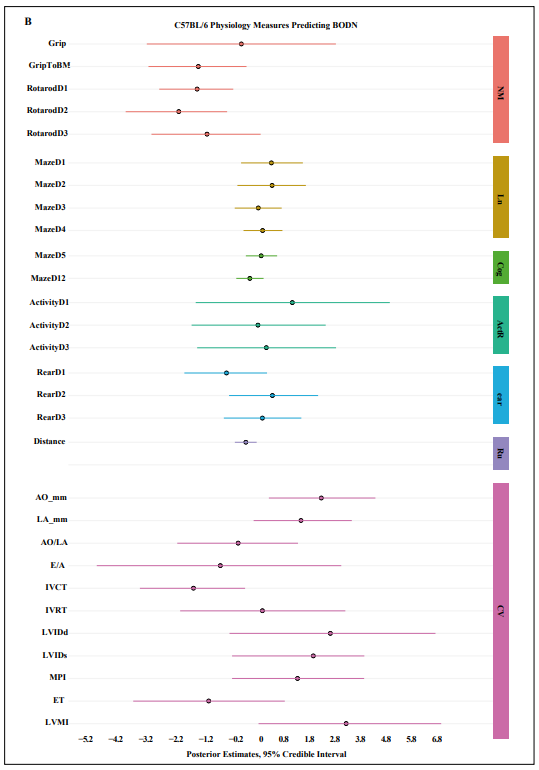
Figure 1. Physiologic predictors of Body Organ Disease Number (BODN) in A) CB6F1, B) C57BL/6 mice. Grip: Grip strength, GriptoBM: normalized grip strength to body size, RotarodD1: rotarod at day 1, MazeD1: Barnes maze at day 1, ActivityD 1: Open field activity at day 1, Rear: Open field activity rearing, AO: aortic valve dimension in millimeter, LA: left ventricular valve, AO/LA: the ratio of AO to LA dimensions, E/ A, E wave to A wave ratio, IVCT: isovolumic contractile time millisecond (msec), IVRT: isovolumic relaxation time (msec), LVIDd: left ventricle internal diameter end diastole, IVIDs: left ventricle intra diameter end systole, MPI: myocardial performance, ET: ejection time., NM: neuromuscular, learn: learning stage, Cog: cognition, Act: Open field activity, Rear: Open field activity rearing, Run: Voluntary wheel running, CV: Cardiovascular physiology, LVMI: left ventricular mass index.
Table 1A.
Physiologic predictors of Body Organ Disease Number (BODN) in CB6F1 mice.
| Physiologic Measures | Coeff | SE | Low 95% CI | Up 95% CI | |
|---|---|---|---|---|---|
| Neuromuscular | Grip | -2.97 | 1.13 | -5.26 | -0.81 |
| Grip to body mass | -3.68 | 0.93 | -5.56 | -1.93 | |
| Rotarod Day 1 | -1.38 | 0.53 | -2.43 | -0.37 | |
| Rotarod Day 2 | -1.72 | 0.57 | -2.86 | -0.63 | |
| Rotarod Day 3 | -1.69 | 0.62 | -2.93 | -0.48 | |
| Learning | Maze Day 1 | 3.24 | 0.90 | 1.53 | 5.07 |
| Maze Day 2 | 1.89 | 0.59 | 0.76 | 3.12 | |
| Maze Day 3 | 1.072 | 0.33 | 0.44 | 1.74 | |
| Maze Day 4 | 0.94 | 0.33 | 0.31 | 1.61 | |
| Cognition | Maze Day 5 | 1.87 | 0.39 | 1.13 | 2.67 |
| Maze Day 12 | 0.72 | 0.22 | 0.30 | 1.16 | |
| Physical activity | Activity Day 1 | -0.21 | 1.002 | -2.16 | 1.77 |
| Activity Day 2 | -0.11 | 0.77 | -1.63 | 1.38 | |
| Activity Day 3 | -1.71 | 0.87 | -3.47 | -0.03 | |
| Rearing Day 1 | Rear Day 1 | 1.49 | 0.55 | 0.44 | 2.59 |
| Rearing Day 2 | Rear Day 2 | 1.24 | 0.39 | 0.49 | 2.02 |
| Rearing Day 3 | Rear Day 3 | 0.44 | 0.42 | -0.38 | 1.27 |
| Running distance | Distance | -0.63 | 0.16 | -0.98 | -0.32 |
| Cardiac Physiology | AO (mm) | 1.38 | 3.13 | -4.64 | 7.62 |
| LA (mm) | -0.51 | 0.56 | -1.64 | 0.56 | |
| AO/LA | -2.31 | 1.03 | -4.39 | -0.32 | |
| E/A | -1.50 | 0.70 | -2.93 | -0.16 | |
| IVCT | 1.49 | 0.76 | 0.02 | 3.03 | |
| IVRT | -0.48 | 1.53 | -3.47 | 2.52 | |
| LVIDd | 3.80 | 1.93 | 0.07 | 7.66 | |
| LVIDs | 2.36 | 1.09 | 0.24 | 4.52 | |
| MPI | 2.03 | 0.99 | 0.12 | 4.01 | |
| ET | -1.65 | 0.78 | -3.23 | -0.18 | |
| LVMI | 2.90 | 1.14 | 0.72 | 5.19 |
Grip: Grip strength, Grip to body mass: normalized grip strength to body size, Rotarod Day 1: rotarod at day 1, Maze Day 1: Barnes maze at day 1, Activity Day 1: Open field activity at day 1, Rear: Open field activity rearing, AO: aortic valve dimension in millimeter, LA: left ventricular valve, AO/LA: the ratio of AO to LA dimensions, E/A, E wave to A wave ratio, IVCT: isovolumic contractile time millisecond (msec), IVRT: isovolumic relaxation time (msec), LVIDd: left ventricle internal diameter end diastole, IVIDs: left ventricle intra diameter end systole, MPI: myocardial performance, ET: ejection time., Rearing: Open field activity rearing, Running distance: Voluntary wheel running, LVMI: left ventricular mass index.
Table 1B.
Physiologic predictors of Body Organ Disease Number (BODN) in C57BL/6 mice.
| Physiologic Measures | Coeff | SE | Low 95% CI | Up 95% CI | |
|---|---|---|---|---|---|
| Neuromuscular | Grip | -0.26 | 1.54 | -3.30 | 2.78 |
| Grip to body mass | -1.64 | 0.80 | -3.24 | -0.09 | |
| Rotarod Day 1 | -1.68 | 0.60 | -2.90 | -0.52 | |
| Rotarod Day 2 | -2.27 | 0.83 | -3.98 | -0.72 | |
| Rotarod Day 3 | -1.36 | 0.90 | -3.15 | 0.36 | |
| Learning | Maze Day 1 | 0.71 | 0.50 | -0.27 | 1.72 |
| Maze Day 2 | 0.73 | 0.56 | -0.39 | 1.81 | |
| Maze Day 3 | 0.29 | 0.38 | -0.47 | 1.03 | |
| Maze Day 4 | 0.42 | 0.32 | -0.19 | 1.06 | |
| Cognition | Maze Day 5 | 0.38 | 0.26 | -0.12 | 0.89 |
| Maze Day 12 | 0.01 | 0.22 | -0.42 | 0.45 | |
| Physical activity | Activity Day 1 | 1.38 | 1.59 | -1.73 | 4.51 |
| Activity Day 2 | 0.27 | 1.10 | -1.86 | 2.45 | |
| Activity Day 3 | 0.55 | 1.13 | -1.68 | 2.78 | |
| Rearing Day 1 | Rear Day 1 | -0.74 | 0.68 | -2.09 | 0.56 |
| Rearing Day 2 | Rear Day 2 | 0.74 | 0.73 | -0.66 | 2.20 |
| Rearing Day 3 | Rear Day 3 | 0.42 | 0.64 | -0.82 | 1.67 |
| Running distance | Distance | -0.11 | 0.18 | -0.47 | 0.23 |
| Cardiac Physiology | AO (mm) | 2.31 | 0.87 | 0.62 | 4.05 |
| LA (mm) | 1.66 | 0.80 | 0.13 | 3.29 | |
| AO/LA | -0.36 | 0.99 | -2.32 | 1.56 | |
| E/A | -0.93 | 1.98 | -4.91 | 2.95 | |
| IVCT | -1.80 | 0.85 | -3.52 | -0.14 | |
| IVRT | 0.41 | 1.35 | -2.23 | 3.08 | |
| LVIDd | 2.60 | 1.69 | -0.64 | 5.98 | |
| LVIDs | 2.05 | 0.92 | -0.56 | 3.69 | |
| MPI | 1.55 | 1.09 | -0.56 | 3.69 | |
| ET | -1.31 | 1.23 | -3.74 | 1.14 | |
| LVMI | 3.11 | 1.49 | 0.29 | 6.16 |
Grip: Grip strength, Grip to body mass: normalized grip strength to body size, Rotarod Day 1: rotarod at day 1, Maze Day 1: Barnes maze at day 1, Activity Day 1: Open field activity at day 1, Rear: Open field activity rearing, AO: aortic valve dimension in millimeter, LA: left ventricular valve, AO/LA: the ratio of AO to LA dimensions, E/A, E wave to A wave ratio, IVCT: isovolumic contractile time millisecond (msec), IVRT: isovolumic relaxation time (msec), LVIDd: left ventricle internal diameter end diastole, IVIDs: left ventricle intra diameter end systole, MPI: myocardial performance, ET: ejection time., Rearing: Open field activity rearing, Running distance: Voluntary wheel running, LVMI: left ventricular mass index.
Organ pathology heterogeneously integrates into body organ disease number
Overall, the BODN was higher for CB6F1 than C57BL/6
at any age. The median and range of BODN were 2 (1-4)
at 8 months, 4 (2-5) at 16 months, 5 (4-7) at 24 months, 6
(5-7) at 32 months for CB6F1;and for C57BL/6 they were
3 (2-4) at 8 months, 5 (4-6) at 16 months, 5 (4-7) at 24
months, 6 (4-7) at 32 months.
Because the pathologies are ordinally graded based on
severity, we used the monotonic effect that is applicable
when the levels are not equidistant, and we showed that
each organ's pathology severity scores heterogeneously
incorporated into body organ disease number (BODN).
The result shows that the degree of organ pathology heterogeneously
incorporated into BODN in both B6F1and
C57BL/6 mice and some pathologies are more dominant
for each strain (Figure 2A-B, Table 2A-B).
We included all pathologies that predict BODN with high
accuracy using LOO-CV (k < 7). The estimates of each pathology level incorporated into BODN are depicted in Figure 2A and B.
The complete model including all organs'
pathology to predict BODN explained variability of
BODN by 87% and 88% for C57BL/6 and CB6F1, respectively. We quantified PathoClock from the model, including
all organ systems to predict BODN using age as levels. There is intermouse variability of PathoClock even
within the same chronological age. Mean PathoClock was mainly larger in CB6F1 compared to C57BL/6, especially
at age 28 months (6.5 ± 1.10 vs. 6.3 ± 0.64) and 32 months (7.6 ± 1.5 vs. 7.3 ± 0.65), respectively. The
between-strain variability (variance) over the age spectrum was 3.3 months. In CB6F1, cardiovascular-related
pathologies with higher uncertainty (the narrow credible intervals excluding 0) were significantly
incorporated into BODN (Figure 2A, Table 2A).
While specific pathologies of each organ variably incorporate
into BODN of the renal system, only kidney mineral disposition had a wide uncertainty in CB6F1. In the C57BL/6
mice, in addition to mineral disposition, amyloid accumulation and acute tubular damage had wide credible
intervals and large uncertainty predicting BODN (Figure 2B, Table 2B). In C57BL/6, the majority of
liver-related pathologies were incorporated into BODN yet heterogeneously. Of note, incorporation of the
regeneration state in BODN in C57BL/6 mice was larger than of the degeneration state. Interestingly, lymphoid
aggregates in almost all organs are significantly incorporated into BODN.
Correlation of pathoClock, physioClock, and chronological age is strain dependent
To understand how well the two final models, the one
including all pathology levels to develop PathoClock and
the one including physiology measures to quantify PhysioClock,
explained BODN, we used the Leave-One-Out
R-squared (LOO_R2) method. The model including all
pathologies to predict BODN for C57BL/6 (PathoClock),
explained about 87% of BODN (LOO_ R2 = 0.87), while
the model used to develop PhysioClock explained BODN
by 64% (LOO_R2 = 0.64). For CB6F1 mice the models
to develop PathoClock explained BODN by 94% (LOO_
R2 = 0.94), and the model used to develop PhysioClock
explained BODN by 67% (LOO_R2 = 0.67). In both
strains the models from which PathoClock was extracted
explained BODN better than PhysioClock; however, in
CB6F1 the overall model performance was better than in
C57BL/6.
The distributions of PathoClock and PhysioClock are
depicted in interactive Figure 3. The correlation of Patho-
Clock and chronological age was r = 0.75 in C57BL/6,
but in CB6F1 the correlation was larger (r = 0.80) (Table
3). In some individual mice, PathoClock was smaller than
BODN, while in some mice, it was larger. These results
suggest variability in incorporating pathology levels in the
same age group and across ages. Also, a larger impact for
pathology levels can be manifested as a larger PathoClock
in mice within the same age group or in an older group.
In contrast, a smaller PathoClock at an older age may
suggest the minor impact of pathology levels on BODN
despite an older age. This result opens a roadmap to study
resilience and body system reactions in relation to pathology
(Figure 3A-B).
Correlation between PhysioClock and age at
euthanasia
in CB6F1 mice was r = 0.71 with variability across age
groups by 3.72 months (sd = 3.7), and the correlation
of PhysioClock with age at euthanasia was r = 0.68 for
C57BL/6 with 6.5 months variability in age (sd = 6.5;
Table 3). Some mice with higher BODN had lower PhysioClock
(at middle age), suggesting physiological resilience
to the development of pathology. However, it could
also be due to an insufficient adaptation response. Despite
the high correlation, the patterns of both PathoClock and
PhysioClock in relation to chronological age were not
linear, and exponential patterns were detected (Figure 3C-D).
PhyisoAge and PathoAge align with chronological age in a strain dependent manner
The common approach to measuring the rate of aging with chronological age has been to regress phenotype measurements over chronological age. Likewise, we developed PhysioAge and PathoAge by regressing the physiological and pathological measurements on chronological age and determining the R2 of the model using the Leave-One-Out approach (LOO_R2) and then assessing the correlation between predicted age and chronological age for Patho- Age and PhysioAge. In C57BL/6 mice, PathoAge, having a larger LOO_R2 and stronger correlation with chronological age, explained chronological age better than PhsyioAge. PathoAge variability across age was 2.5 months while the variability of PhysioAge was 3.9 months (Table 3). In CB6F1, both PathoAge and PhysioAge strongly explained chronological age, with PathoAge (LOO_R2 = 0.93) explaining chronological age better than PhysioAge (Loo_R2 = 0.7). In C57BL/6 mice, there was a slow slope of correlation between PhysioAge and ChAge so that the PhysioAge at younger ages had similarities with middle age groups (Figure 4).
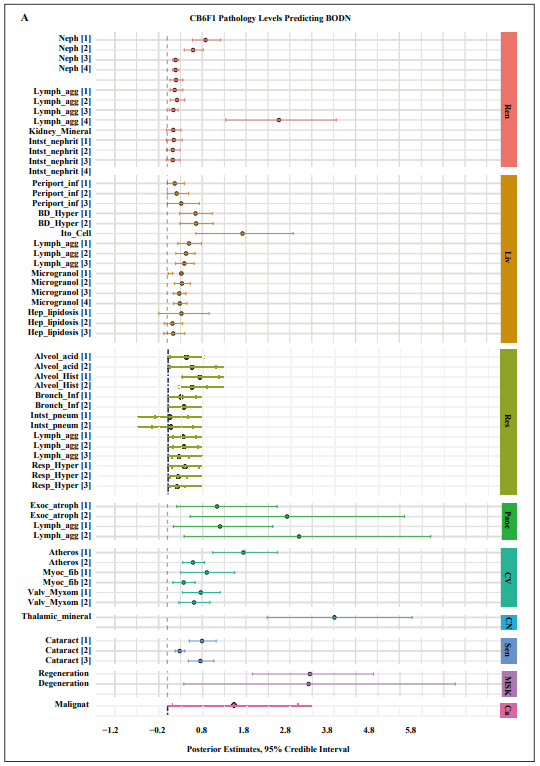
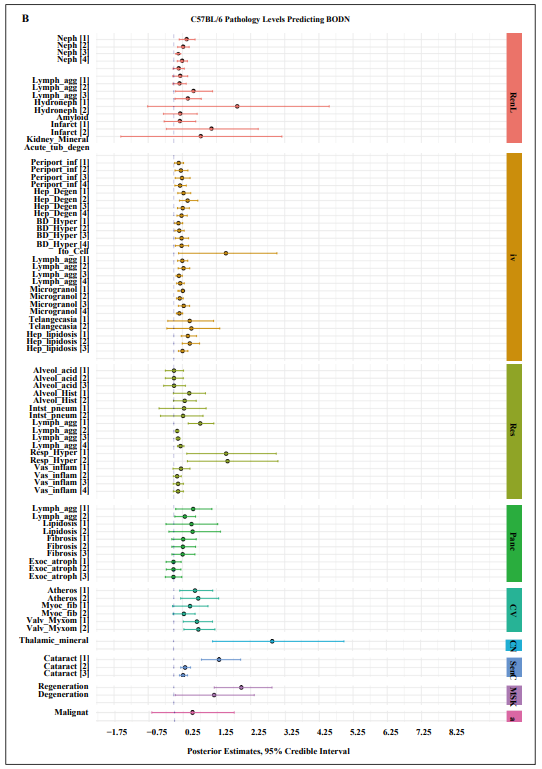
Figure 2. Pathology levels of seven organs in A) CB6F1 and B) C57BL/6 male mice incorporating Body Organ Disease Number.Abbreviations: Neph: nephropathy, lymph_agg: lymphocyte aggregation, Infarct: infarction, Kidney_mineral: mineral deposition in kidney, Acute, tub_degen: acute tubular degeneration, perioport_inf: periportal infiltration, Hep_Degen: hepatic degeneration, BD_Hyper: bile duct hyperplasia, Ito_cell: itocell hyperplasia, Microgranol: microgranuloma, Hep_lipidosis: hepatic lipidosis, Alveol acid: alveolar macrophage pneumonia, alveol_hist: alveolar histiocytosis, Resp_hyper: respiratory duct hyperplasia, Vas_inflam: perivascular inflammation, exoc_atroph: exocrine atrophy, Atheros: atherosclerosis, Myco_fib: myocardial fibrosis, Valve_Myxom: valvular myxomatosis, thalamic mineral: mineral deposition in thalamus area, Regeneration: skeletal muscle degeneration, regeneration: skeletal muscle regeneration, malignant: malignant cancer. All the pathology levels are compared to no lesions [0] as the reference.
Table 2A.
Organ system histology levels predicting Body Organ Disease Number in CB6F1 mice.
| Systems | Disease | Beta Coeff | SE | Low 95% CI | Up 95% CI |
|---|---|---|---|---|---|
| Renal | Nephropathy [1] | 0.8740 | 0.1610 | 0.5750 | 1.2190 |
| Nephropathy [2] | 0.5890 | 0.5890 | 0.3875 | 0.8215 | |
| Nephropathy [3] | 0.1900 | 0.0340 | 0.1260 | 0.2650 | |
| Nephropathy [4] | 0.1910 | 0.036 | 0.1280 | 0.2670 | |
| Lymph aggregate [1] | 0.1998 | 0.0729 | 0.0621 | 0.3564 | |
| Lymph aggregate [2] | 0.1702 | 0.0621 | 0.0621 | 0.3564 | |
| Lymph aggregate [3] | 0.2220 | 0.0810 | 0.0690 | 0.3960 | |
| Lymph aggregate [4] | 0.1406 | 0.0513 | 0.0437 | 0.2508 | |
| Kidney Mineralization [1] | 2.5510 | 0.6481 | 1.3340 | 3.8607 | |
| Interstitial nephritis [1] | 0.1375 | 0.0825 | -0.0175 | 0.3150 | |
| Interstitial nephritis [2] | 0.1485 | 0.0891 | -0.0189 | 0.3402 | |
| Interstitial nephritis [3] | 0.1265 | 0.0759 | -0.0161 | 0.2898 | |
| Interstitial nephritis [4] | 0.1265 | 0.0429 | -0.0161 | 0.2898 | |
| Liver | Periportal inflammation [1] | 0.1704 | 0.0984 | 0.00216 | 0.3912 |
| Periportal inflammation [2] | 0.2130 | 0.1230 | 0.0027 | 0.4890 | |
| Periportal inflammation [3] | 0.3195 | 0.1845 | 0.0036 | 0.7330 | |
| Bile duct hyperplasia [1] | 0.6468 | 0.1862 | 0.2842 | 1.0290 | |
| Bile duct hyperplasia [2] | 0.6600 | 0.1900 | 0.2900 | 1.0500 | |
| Ito Cell hyperplasia [1] | 1.7182 | 0.5664 | 0.6549 | 2.8760 | |
| Lymph aggregate [1] | 0.4958 | 0.1369 | 0.2405 | 0.7844 | |
| Lymph aggregate [2] | 0.4288 | 0.1184 | 0.1950 | 0.6360 | |
| Lymph aggregate [3] | 0.3886 | 0.1073 | 0.1885 | 0.6148 | |
| Microgranular aggregate [1] | 0.3224 | 0.0858 | 0.0208 | 0.1248 | |
| Microgranular aggregate [2] | 0.3348 | 0.0891 | 0.1620 | 0.5265 | |
| Microgranular aggregate [3] | 0.2728 | 0.0726 | 0.1386 | 0.4290 | |
| Microgranular aggregate [4] | 0.2852 | 0.0759 | 0.1449 | 0.4485 | |
| lipidosis [1] | 0.3245 | 0.3025 | -0.1925 | 0.9570 | |
| lipidosis [2] | 0.1180 | 0.1100 | -0.0700 | 0.3480 | |
| lipidosis [3] | 0.1357 | 0.1265 | -0.0805 | 0.4002 | |
| Respiratory | Alveolar acidosis [1] | 0.4343 | 0.2021 | 0.0473 | 0.8428 |
| Alveolar acidosis [2] | 0.5656 | 0.2632 | 0.0616 | 1.0976 | |
| Alveolar histiocytosis [1] | 0.7392 | 0.2128 | 0.3360 | 1.1872 | |
| Alveolar histiocytosis [2] | 0.5676 | 0.1634 | 0.2580 | 0.9116 | |
| Bronchial Inflammation [1] | 0.3124 | 0.1672 | 0.00004 | 0.6512 | |
| Bronchial Inflammation [2] | 0.3850 | 0.2090 | 0.00006 | 0.814 | |
| Inessential pneumonia [1] | 0.0616 | 0.1892 | -0.2904 | 0.462 | |
| Interstitial pneumonia [2] | 0.0770 | 0.2365 | -0.3630 | 0.5775 | |
| Lymph aggregate [1] | 0.3535 | 0.1295 | 0.1225 | 0.6475 | |
| Lymph aggregate [2] | 0.3737 | 0.1369 | 0.1295 | 0.6845 | |
| Lymph aggregate [3] | 0.2727 | 0.0999 | 0.0945 | 0.4995 | |
| Respiratory hyperplasia [1] | 0.4005 | 0.1530 | 0.1080 | 0.7245 | |
| Respiratory hyperplasia [2] | 0.2492 | 0.0952 | 0.0672 | 0.4480 | |
| Respiratory hyperplasia [3] | 0.2225 | 0.0850 | 0.0600 | 0.4000 | |
| Pancreas | Exocrine atrophy [1] | 1.0640 | 0.8596 | 0.2044 | 3.5000 |
| Exocrine atrophy [2] | 1.3490 | 1.08985 | 0.25915 | 4.4375 | |
| Lymph aggregate [1] | 0.9360 | 0.7930 | 0.1352 | 3.1200 | |
| Lymph aggregate [2] | 1.3140 | 1.1132 | 0.1898 | 4.3800 | |
| CV | Atherosclerosis [1] | 1.7390 | 0.3700 | 1.0300 | 2.5100 |
| Atherosclerosis [2] | 0.5875 | 0.1250 | 0.3500 | 0.8500 | |
| Fibrosis [1] | 0.9030 | 0.3080 | 0.3080 | 1.5400 | |
| Fibrosis [2] | 0.3741 | 0.1276 | 0.1276 | 0.638 | |
| Valve myxoma [1] | 0.7645 | 0.2200 | 0.3465 | 1.2100 | |
| Valve myxoma [2] | 0.6116 | 0.1760 | 0.2640 | 0.9768 | |
| CNS | Thalamic mineralization [1] | 3.8187 | 0.8417 | 2.2818 | 5.5921 |
| Sensory | Cataract [1] | 0.7938 | 0.1512 | 0.504 | 1.1172 |
| Cataract [2] | 0.2835 | 0.0540 | 0.1800 | 0.3990 | |
| Cataract [3] | 0.7560 | 0.1440 | 0.4800 | 1.0640 | |
| Muscle | Muscle regeneration [1] | 3.2460 | 0.7061 | 1.9342 | 4.6973 |
| Muscle degeneration [1] | 3.2169 | 1.5585 | 0.3723 | 6.5585 | |
| Pancreas | Exocrine atrophy [1] | 1.0640 | 0.8596 | 0.2044 | 3.5000 |
| Exocrine atrophy [2] | 1.3490 | 1.08985 | 0.25915 | 4.4375 | |
| Lymph aggregate [1] | 0.9360 | 0.7930 | 0.1352 | 3.1200 | |
| Lymph aggregate [2] | 1.3140 | 1.1132 | 0.1898 | 4.3800 | |
| Cancer | Any malignant tumor [1] | 1.5186 | 0.7279 | 0.1156 | 2.9808 |
SE: Standard error, CV: cardiovascular system, CNS: central nervous system.
Table 2B.
Organ system histology levels predicting Body Organ Disease Number in C57BL/6 mice.
| Systems | Disease | Beta Coeff | SE | Low 95% CI | Up 95% CI |
|---|---|---|---|---|---|
| Renal | Nephropathy [1] | 0.3672 | 0.1152 | 0.1584 | 0.6228 |
| Nephropathy [2] | 0.2652 | 0.0780 | 0.1144 | 0.4498 | |
| Nephropathy [3] | 0.1224 | 0.0384 | 0.0528 | 0.2041 | |
| Nephropathy [4] | 0.2346 | 0.0736 | 0.1012 | 0.3979 | |
| Lymph aggregation [1] | 0.1344 | 0.0840 | -0.0224 | 0.3080 | |
| Lymph aggregation [2] | 0.1776 | 0.1110 | -0.0296 | 0.4070 | |
| Lymph aggregation [3] | 0.1584 | 0.0990 | -0.0264 | 0.3630 | |
| Hydronephrosis [1] | 0.5684 | 0.2726 | 0.0522 | 1.1368 | |
| Hydronephrosis [2] | 0.4018 | 0.1927 | 0.0369 | 0.8036 | |
| Amyloidosis | 1.8581 | 1.3438 | -0.7660 | 4.5509 | |
| Infarction [1] | 0.1785 | 0.2499 | -0.3009 | 0.6834 | |
| Infarction [2] | 0.1680 | 0.2352 | -0.2832 | 0.6432 | |
| Kidney mineralization | 1.0949 | 0.6853 | -0.2180 | 2.4723 | |
| Tubular degeneration | 0.7806 | 1.2956 | -1.7512 | 3.3652 | |
| Liver | Periportal infiltration [1] | 0.1440 | 0.0648 | 0.0252 | 0.2862 |
| Periportal infiltration [2] | 0.2080 | 0.2080 | 0.0364 | 0.4134 | |
| Periportal infiltration [3] | 0.2400 | 0.1080 | 0.0420 | 0.4770 | |
| Periportal infiltration [4] | 0.1840 | 0.0828 | 0.0322 | 0.3657 | |
| Hepatic degeneration [1] | 0.2856 | 0.0960 | 0.1176 | 0.4968 | |
| Hepatic degeneration [2] | 0.4046 | 0.1360 | 0.1666 | 0.7038 | |
| Hepatic degeneration [3] | 0.2618 | 0.0880 | 0.1078 | 0.4554 | |
| Hepatic degeneration [4] | 0.2261 | 0.0760 | 0.0931 | 0.3933 | |
| Bile Duct hyperplasia [1] | 0.1368 | 0.0576 | 0.0288 | 0.2610 | |
| Bile Duct hyperplasia [2] | 0.1596 | 0.0672 | 0.0336 | 0.3045 | |
| Bile Duct hyperplasia [3] | 0.2280 | 0.0960 | 0.0480 | 0.4350 | |
| Bile Duct hyperplasia [4] | 0.2280 | 0.0960 | 0.0480 | 0.4350 | |
| Ito Cell hyperplasia | 1.5260 | 0.7330 | 0.1411 | 3.0196 | |
| Lymph aggregation [1] | 0.2492 | 0.0756 | 0.1120 | 0.4088 | |
| Lymph aggregation [2] | 0.2848 | 0.0864 | 0.1208 | 0.4672 | |
| Lymph aggregation [3] | 0.1513 | 0.0459 | 0.0680 | 0.2482 | |
| Lymph aggregation [4] | 0.1869 | 0.0567 | 0.0840 | 0.3066 | |
| microgranuloma [1] | 0.2639 | 0.0754 | 0.1218 | 0.1595 | |
| microgranuloma [2] | 0.1729 | 0.0494 | 0.0798 | 0.2755 | |
| microgranuloma [3] | 0.2912 | 0.0832 | 0.1344 | 0.4640 | |
| microgranuloma [4] | 0.1638 | 0.0468 | 0.0756 | 0.2610 | |
| Telangiectasia [1] | 0.4653 | 0.3525 | -0.1755 | 1.1655 | |
| Telangiectasia [2] | 0.5148 | 0.3901 | -0.2028 | 1.3468 | |
| Hepatic lipidosis [1] | 0.4118 | 0.1131 | 0.2175 | 0.6641 | |
| Hepatic lipidosis [2] | 0.4686 | 0.1287 | 0.2475 | 0.7557 | |
| Hepatic lipidosis [3] | 0.2556 | 0.0702 | 0.135 | 0.4122 | |
| Respiratory | Hepatic lipidosis [1] | 0.4118 | 0.1131 | 0.2175 | 0.6641 |
| Hepatic lipidosis [2] | 0.4686 | 0.1287 | 0.2475 | 0.7557 | |
| Hepatic lipidosis [3] | 0.2556 | 0.0702 | 0.135 | 0.4122 | |
| Alveolar histiocytosis [1] | 0.4524 | 0.2378 | -0.0116 | 0.9280 | |
| Alveolar histiocytosis [2] | 0.3198 | 0.1681 | -0.0082 | 0.6560 | |
| Interstitial pneumonia [1] | 0.3016 | 0.3276 | -0.4316 | 0.9464 | |
| Interstitial pneumonia [2] | 0.2726 | 0.2961 | -0.3901 | 0.8554 | |
| Lymph aggregation [1] | 0.7749 | 0.1890 | 0.4221 | 1.1718 | |
| Lymph aggregation [2] | 0.0984 | 0.0240 | 0.0536 | 0.1488 | |
| Lymph aggregation [3] | 0.1230 | 0.0301 | 0.0670 | 0.1860 | |
| Lymph aggregation [4] | 0.1968 | 0.0480 | 0.1072 | 0.2976 | |
| Respiratory Hyperplasia [1] | 1.5328 | 1.0560 | 0.3808 | 3.9001 | |
| Respiratory Hyperplasia [2] | 1.5745 | 1.1055 | 0.3986 | 4.3550 | |
| Vascular inflammation [1] | 0.2109 | 0.1221 | -0.0222 | 0.4736 | |
| Vascular inflammation [2] | 0.0969 | 0.0561 | -0.0119 | 0.2176 | |
| Vascular inflammation [3] | 0.1254 | 0.0726 | -0.0154 | 0.2816 | |
| Vascular inflammation [4] | 0.1254 | 0.0726 | -0.0132 | 0.2816 | |
| Pancreas | Lymph aggregation [1] | 0.5670 | 0.2646 | 0.0567 | 1.1151 |
| Lymph aggregation [2] | 0.3240 | 0.1512 | 0.0324 | 0.6372 | |
| Lipidosis [1] | 0.5184 | 0.3601 | -0.2272 | 1.2864 | |
| Lipidosis [2] | 0.5508 | 0.3825 | -0.1428 | 1.3668 | |
| Fibrosis [1] | 0.2754 | 0.1802 | -0.0578 | 0.6562 | |
| Fibrosis [2] | 0.2673 | 0.1749 | -0.0561 | 0.6369 | |
| Fibrosis [3] | 0.2592 | 0.1696 | -0.0544 | 0.6176 | |
| Exocrine atrophy [1] | 0.0096 | 0.1120 | -0.2240 | 0.2144 | |
| Exocrine atrophy [2] | 0.0093 | 0.0527 | -0.2201 | 0.2077 | |
| Exocrine atrophy [3] | 0.0105 | 0.1225 | -0.2485 | 0.2345 | |
| CV | Atherosclerosis [1] | 0.6210 | 0.2438 | 0.1748 | 1.1408 |
| Atherosclerosis [2] | 0.7155 | 0.2809 | 0.2014 | 1.3144 | |
| Myocardial fibrosis [1] | 0.4758 | 0.2562 | -0.0366 | 1.0004 | |
| Myocardial fibrosis [2] | 0.2964 | 0.1596 | -0.0228 | 0.6232 | |
| Valvular myxomatosis [1] | 0.6768 | 0.2160 | 0.2784 | 1.1328 | |
| Valvular myxomatosis [2] | 0.7191 | 0.2295 | 0.2958 | 1.2036 | |
| CNS | Thalamic mineralization | 2.8945 | 1.2855 | 1.1442 | 5.9831 |
| Sensory | Cataract [1] | 1.3260 | 0.2924 | 0.8092 | 1.9584 |
| Cataract [2] | 0.3315 | 0.0731 | 0.2023 | 0.4896 | |
| Cataract [3] | 0.2730 | 0.0602 | 0.1666 | 0.4032 | |
| Muscle | Muscle regeneration [1] | 1.9779 | 0.4315 | 1.1847 | 2.8763 |
| Muscle degeneration [1] | 1.1812 | 0.5901 | 0.0448 | 2.3558 | |
| Cancer | Any malignant tumor [1] | 0.5266 | 0.6146 | -0.6678 | 1.7486 |
SE: Standard error, CV: cardiovascular system, CNS: central nervous system.
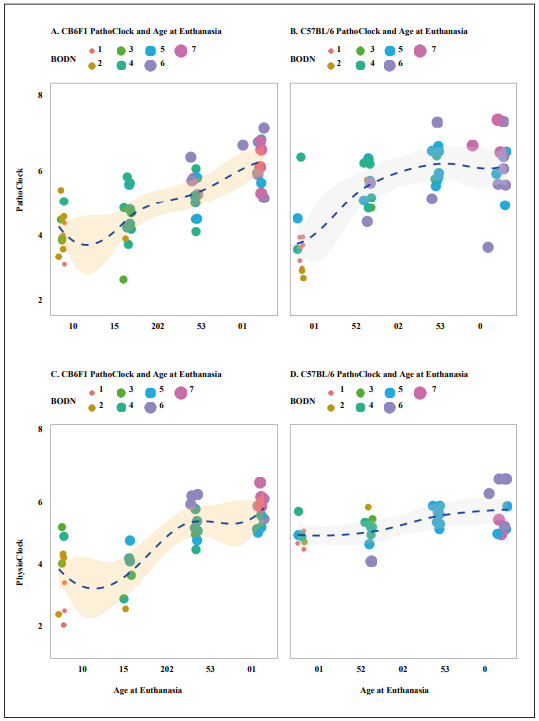
Figure 3. The distribution of PathoClock and PhysioClock by age. To see the 3D figures, click on the included links. PathoClock is determined by how each pathology level incorporates into Body Organ Disease Number (BODN). A. PathoClock in CB6F1 mice and age at euthanasia. B. PathoClock in C57BL/6 mice and age at euthanasia. PhysioClock was determined by how each physiological measures predicted BODN. C. CB6F1 PhysioClock and age at euthanasia. D. C57BL/6 PhysioClock and age at euthanasia.
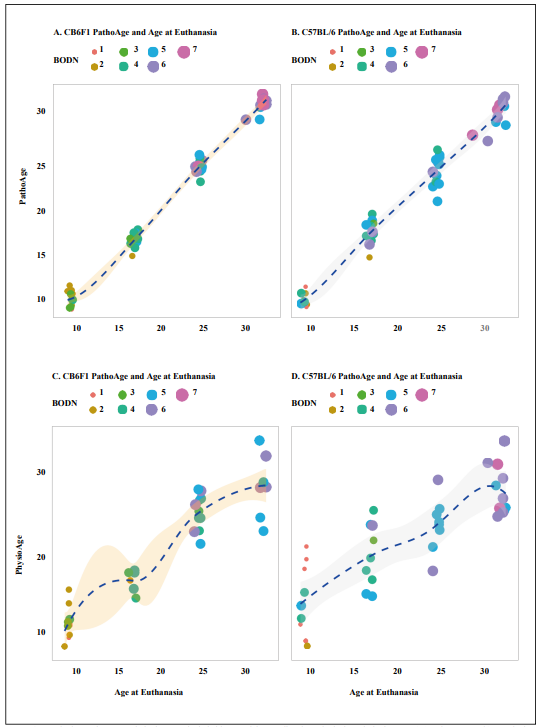
Figure 4. Developing PathoAge, pathologies were included in a model to predict chronological age in both A. CB6F1 and B. C57BL/6. Developing PhysioAge, the same physiological measures as the ones used in Physioclock, were regressed over chronological age in both C. CB6F1 and D. C57BL/6. While PathoAge are almost linearly predict chronological age with some subtle degree of uncertainty, PhysioAge in both strains endures more uncertainty to predict chronological age. The size and color indicate the increase in number of body organ disease number (BODN).
Table 3.
Leave-One-Out (LOO) R squared of models for developing PathoClock, PhysioClock, PathoAge and PhysioAge and the correlation with chronological age.
| LOO-R2 (Sd or sigma) C57BL/6 |
Correlation (r) with ChAge (C57BL/6) |
LOO-R2 (Sd or sigma) CB6F1 |
Correlation (r) with ChAge (CB6F1) |
|
|---|---|---|---|---|
| Model For PhysioClock | 0.87, (sd = 5.7 months) | 0.76 | 0.94, (sd = 7.4 months) | 0.80 |
| Model For PhysioClock | 0.64, (sd = 6.7 months) | 0.68 | 0.67, (sd = 3.7 months) | 0.73 |
| Model for PathoAge | 0.86, (sigma = 2.5 months) | 0.98 | 0.93, (sigma = 2 .4 months) | 0.98 |
| Model for PhysioAge | 0.75, (Sigma = 3.9 months) | 0.83 | 0.70, (Sigma = 4.0 months) | 0.93 |
Sd: standard deviation for model levels in multilevel analyses, sigma is the variance of Gaussian family for continuous outcome. ChAge: Chronological Age.
Discussion
In this study, physiology performance and pathology data
were generated from C57BL/6 and CB6F1 male mice
ranging from 4 to 28 months of age. As a result of these
data, pathology-based multimorbidity as an outcome
was developed and is reported for the first time, with the
pathological and physiological determinants designated
as PathoClock, and PhysioClock, respectively. Using
histopathology lesion scores in each organ as a proxy for
diseases, the morbidity of each organ system was defined
as at least two low pathology grades (= 1) or one higher
pathology grade (> 1). The sum of the organ systems'
morbidities determined the Body Organ Disease Number
(BODN) as a new outcome representing a global index of
health at the body organ system level, resembling what
was recently developed and validated in a multimorbidity
study of human aging [16]. The degree to which each
organ-specific pathology level incorporates into BODN
was assessed. The mouse strain-specific pathology levels
predicting BODN was termed PathoClock, a counterpart
of Body Clock in humans [16]. Because physiological
responses can vary by age and disease level, BODN was
used as an outcome for determining physiological predictors
developing PhysioClock which association with
chronological age was assessed. The results showed that
various levels of the pathology of various organs hetergeneously
incorporate into BODN. CB6F1 mice had a larger
BODN and PathoClock compared to C57BL/6 mice in the
same age group.
Interestingly, the two strains had distinct pathological and
physiological components that predicted BODN. While
aortic valve (AO) and left atrium (LA) dimensions significantly
predicted BODN in C57BL/6 mice, in CB6F1
mice only the AO to LA ratio was a significant predictor
of BODN. There was an inverse association of the E/A
ratio with BODN in CB6F1. A decreased E/A ratio which
is usually an indicator of diastolic heart failure suggests fibrosis
so that the left ventricle cannot be filled with blood
during the diastolic period between two contractions.
Similarly, heart failure in humans is one of the
age-related
changes incorporated into BODN [16] and a health burden
underlying hospitalization of older adults [35]. Moreover,
in older adults decrease in the E/A ratio incorporates
into low exercise intolerance. The results in CB6F1 mice
showed both an inverse association of voluntary exercise
(running distance) and E/A ratio with BODN.
In both strains, while the Left ventricle dimension in
endsystole
(LVIDs) significantly predicted BODN, the left
ventricle dimension in end-diastole (LVIDd) predicted
BODN but with larger uncertainty. Shortening ejection
time (ET), which has been suggested as a single indicator
of human heart failure [36-38] , significantly predicted
BODN in CB6F1. A human study of echocardiographic
measures has shown that a combination of both systolic
and diastolic impairments is a better predictor of heart
failure [37], as such a measure like the myocardial performance
index (MPI) was a significant predictor of BODN
in CB6F1, and it also predicted BODN in C57BL/6, albeit
with some uncertainty. Left ventricular hypertrophy index
normalized by tibial length (LVMI), an age-related change
significantly predicted BODN in both strains. Cardiac
physiology markers were associated with BODN more
strongly in CB6F1 mice than C57BL/6. Having more
uncertainties in cardiac physiology measures, C57BL/6
mice might manifest cardiac physiology changes late in
life or have physiological adaptation to histopathological
changes later. Although PhysioClocks for both strains
were associated with chronological age at euthanasia, the
correlation was stronger in CB6F1, and there was larger
variability in PhysioClock in C57BL/6 than in CB6F1.
Replicative studies and response to interventions are required
to replicate cardiac physiology changes in response
to pathology.
There was variability in both organ physiology and pathology
across strains and age groups. The ability to
maintain neuromuscular and cognitive performance is an
important component of healthspan in aging. Impaired
physical activity and function are both causes and consequences
of disease in humans [39]. Albeit heterogeneous,
older C57BL/6 mice had uncertainties in physical activity
capacity in relation to BODN, while CB6F1 showed decreased
balance, physical activity, lower running distance,
and lower grip strength, all of which predicted increased
BODN. All of these measures had a larger uncertainty in
C57BL/6 to predict BODN. One possible explanation for
the wider uncertainty of physiologic measures in the prediction
of BODN in C57BL/6 is that some male C57Bl/6 mice at age 4 months might have already commenced
physiological changes in response to pathology so that
they are already similar to middle-aged mice. However,
the C57BL/6 PhysioClock at older ages showed a relatively
slow slope over the age spectrum which suggests
resilience in physical function due to regenerative capacity
in skeletal muscle in this strain as shown in their histopathology
and association with BODN.
CB6F1 mice showed a more significant cognitive decline,
attenuated volitional physical activity, disturbed balance,
and diminished motor function in predicting BODN,
while such functional measures did not significantly predict
BODN in C57BL/6. The results suggest that C57BL/6
are also more resilient to functional decline than CB6F1
and/or might develop functional decline variability. While
these two strains are commonly used in the study of normal
aging, our results suggest strain-specific variability in
pathological and physiological domains. However, mechanisms
of functional resilience and whether there is more
variability in functional impairment in C57BL/6, despite
developing pathologies, can be explored by comparing
PathoClock and PhysioClock in both strains and measuring
in-depth mechanistic markers in response to anti-aging
interventions.
Recent reports in both CB6F1 and C57BL/6 mice show
different organ aging, suggesting higher pathology scores
in the cardiovascular system in CB6F1 and early onset
of liver and kidney aging in C57BL/6 and organ-specific
response to anti-aging interventions [40]. Because the aging
kidney and liver show early and dominant age-related
characteristics in C57BL/6, the inclusion of physiological
markers of such organs to predict BODN may improve
PhysioClock for both strains. Moreover, adding more
organs to pathological studies, and obtaining more information
by applying artificial intelligence to the images
to extract high throughput information on echocardiography,
pathology and other imaging can be incorporated
into BODN and can update PathoClock and PhysioClock
whenever this information is available.
In both strains, PathoClock was more strongly correlated
with chronological age, with the CB6F1 PathoClock having
a larger correlation, and we found variability in components
of pathology and physiology across age groups.
Recently, a new study applied the frailty component
on chronological age FRAIL (Frailty Inferred Geriatric
Health Timeline) and measuring lifespan with AFRAID
(Analysis of Frailty and Death,) in C57BL/6 mice predicted
age with r2 = 0.64 in the test data [12]. Our models
based on pathology or physiology more significantly
predicted the animal's chronological age with PathoAge
in both strains and PhysioAge mainly in CB6F1. In addition,
PathoClock based on BODN showed a stronger
correlation with chronological age (in CB6F1, r = 0.8; in
C57BL/6, r = 0.76), and likewise, PhysioClock had larger
correlation with chronological age (CB6F1: r = 0.73;
C57Bl/6: r = 0.68). In both strains, the models from which
PathoClock was extracted explained BODN better than
PhysioClock, with model performances better for CB6F1
than C57BL/6. Similarly, PathoAge better predicted
chronological age than PhysioAge with a larger correlation
between observed and predicted chronological age.
One possible explanation for the different correlations
is the wider variability and uncertainty in physiological
measures in predicting BODN and chronological age.
Also, the data showed an exponential association between
physiological-based predicted age and chronological rather
than linear. Another possibility is that we had smaller
sample sizes for physiological measurements (30 mice in
C57BL/6 and 35 in CB6F1).
In CB6F1 mice, the lower running distance was associated
with larger BODN and Maze tests, and physical activity
at day 3 and rearing activity at days 1 and 2 were significantly
predicted BODN. However, these results were not
significant in CB57BL/6. One possible explanation is that
functional decline occurs later in life and histopathologic
changes in other organs appear sooner, as epidemiological
studies have reported in humans. Cognitive decline and
disability are mainly saturated late in life. In this study,
the mice were euthanized at a specific time, and perhaps
longer follow-up can test this surmise. Moreover, there is
strain discrepancy so that C57Bl/6 showed more regeneration
than degeneration in skeletal muscle, suggesting
the regenerative capacity of skeletal muscle maintains the
physical activity in this mouse strain. Further studies with
longer follow-up time and serial measurements of physical
activities in both sexes are required to shed additional
light on possible mechanisms underlying these results. To
better delineate pattern recognition, replication of these
analyses including a larger sample size would be helpful.
The two clocks developed, PathoClock and PhysioClock,
are strong healthspan tools. In human aging, metrics that
are statistically trained on phenotypes also predict health
states [16]. One caveat of basing the data on chronological
age is that there is arbitrarily consideration of chronological
age as a variable outcome, while chronological age is a
fixed number in an equation. Moreover, biomarker-based
measures can fluctuate irregularly across age spectrums
due to a variety of reasons such as adaptation, resilience,
or severe organ damage. However, prediction of health
outcomes like BODN can capture biological and pathophysiological
changes independent of chronological age,
as well as the variability of biological age. While BODN
and PathoClock can be used at the endpoint for healthspan,
the PhysioClock can be used as a repeated measure
in longitudinal studies to predict healthspan over time.
The results of previously measured pathologies can be
applied in the Bayesian models we developed, along with
physiological measures, to predict BODN in aging studies
using mice and can be used dynamically to further delineate
mechanisms of aging [41]. Including components
of pathology and or physiology into the models provides
the ability to predict chronological age and integration
into global health status measured as BODN. Our study
revealed between- and within-age variabilities in Patho-
Clock and PhysioClock, as well as between-strain variabilities.
For the first time, we applied BODN to
histopathology
and developed PathoClock and PhysioClock to recapitulate
human BODN and Body Clock, which can be used
to compare the rate of aging across various rodent strains
and other mammalian species. Our findings are novel as,
for the first time, we employed human BODN histopathology,
developing the PathoClock and PathoAge that show
the rate of aging independent of chronological age, resembling
human BODN and Body Clock. Furthermore, these
tools can be used in other mouse strains to compare the
rate of aging across various rodent strains and other mammalian
species. Considering organ-specific aging in mouse
strains and heterogeneity in organ aging in humans, it is of
paramount importance to disentangle individual-specific
and organ-specific aging and how each disease state and
adaptation state incorporates into the whole-body system
as a function of BODN. The PathoClock and PhysioClock
can be employed as translatable tools, recapitulating the
human Body Clock. These clocks can be used across various
species and in both males and females to determine
common and distinguished pathologies and physiological
assessments applied to age-related healthspan.
Impractical pan-organ histopathology studies in humans
might limit the translatability of non-human histopathologic
tools. One possibility is to compare human organoids
with histopathology studies of other species, as the
mammalian body systems are one entropy with interactions
between systems. Therefore, the study of organoids
could limit us from capturing the effect of one organ on
others as we captured by BODN. Clinically defined diseases
in humans usually track well with underlying histopathologic
changes. Thus, determining animal models that
can recapitulate clinically defined human multimorbidity
is still crucial for translational purposes.
In this study, we applied the human BODN and Body
Clock algorithms to histopathology data collected in two
widely used mice strains. Future studies and replications
in the same strains and/or in other mouse strains will disentangle
similarities and differences across various strains.
Quantifying individual Clock levels can be used to more
precisely understand mechanisms of aging [41-43] and
assess the rate of aging using cross-species translational
tools to disentangle age-related similarities and differences
and assess organ-, strain- and sex-specific effects of aging
intervention studies. Using Bayesian inference allows
us to predict such Clocks in established as well as new
models and updates can be made when new information at
physiological or pathological data become available.
Declarations
Availability of data and materials
Not applicable.
Financial support and sponsorship
Supported by NIH grants NIA-B K01AG059898 (PI, Shabnam Salimi), R24 AG047115, R56 AG058543, and R01 AG057381 (PI, Warren Ladiges), and P30 AG067000 (PI, Kaberlein).
Conflicts of interest
Warren Ladiges is a member of the Editorial Board of Aging Pathobiology and Therapeutics. All authors declare no conflict of interest and were not involved in the journal's review or desicions related to this manuscript.
Ethical approval and consent to participate
Not applicable.
References
1. Fabbri E, Zoli M, Gonzalez-Freire M, et al. Aging and multimorbidity: new tasks, priorities, and frontiers for integrated gerontological and clinical research. Journal of the American Medical Directors Association, 2015, 16(8): 640-647.
2. Salive M E. Multimorbidity in older adults. Epidemiologic Reviews, 2013, 35(1): 75-83.
3. Salive M E, Suls J, Farhat T, et al. National Institutes of Health Advancing Multimorbidity Research. Medical Care, 2021, 59(7): 622-624.
4. Ferrucci L, Gonzalez-Freire M, Fabbri E, et al. Measuring biological aging in humans: A quest. Aging Cell, 2020, 19(2): e13080.
5. Ladiges W. The emerging role of geropathology in preclinical aging studies. Pathobiology of Aging & Agerelated Diseases, 2017, 7(1): 1304005.
6. Olstad K J, Imai D M, Keesler R I, et al. Development of a Geropathology Grading Platform for nonhuman primates. Aging Pathobiology and Therapeutics, 2020, 2(1): 16.
7. Rockwood K, Blodgett J M, Theou O, et al. A frailty index based on deficit accumulation quantifies mortality risk in humans and in mice. Scientific Reports, 2017, 7(1): 1-10.
8. Whitehead J C, Hildebrand B A, Sun M, et al. A clinical frailty index in aging mice: comparisons with frailty index data in humans. Journals of Gerontology Series A: Biomedical Sciences and Medical Sciences, 2014, 69(6): 621-632.
9. Feridooni H A, Kane A E, Ayaz O, et al. The impact of age and frailty on ventricular structure and function in C57BL/6J mice. The Journal of Physiology, 2017, 595(12): 3721-3742.
10. Snyder J M, Snider T A, Ciol M A, et al. Validation of a geropathology grading system for aging mouse studies. GeroScience, 2019, 41(4): 455-465.
11. Ladiges W. Pathology assessment is necessary to validate translational endpoints in preclinical aging studies. Pathobiology of Aging & Age-related Diseases, 2016, 6: 31478.
12. Schultz M B, Kane A E, Mitchell S J, et al. Age and life expectancy clocks based on machine learning analysis of mouse frailty. Nature Communications, 2020, 11(1): 1-12.
13. Richardson A, Fischer K E, Speakman J R, et al. Measures of healthspan as indices of aging in mice—a recommendation. Journals of Gerontology Series A: Biomedical Sciences and Medical Sciences, 2016, 71(4): 427-430.
14. Schriner S E, Linford N J, Martin G M, et al. Extension of murine life span by overexpression of catalase targeted to mitochondria. Science, 2005, 308(5730): 1909-1911.
15. Niedernhofer L J, Kirkland J L, Ladiges W. Molecular pathology endpoints useful for aging studies. Ageing Research Reviews, 2017, 35: 241-249.
16. Salimi S, Vehtari A, Salive M, et al. Body clock: Matching personalized multimorbidity and fast aging using information entropy. MedRxiv, 2021,
17. Pena A, Michelsen M M, Mygind N D, et al. Coronary microvascular dysfunction is associated with cardiac time intervals in women with angina and no obstructive coronary artery disease: An iPOWER substudy. Echocardiography, 2019, 36(6): 1110-1117.
18. Dai D F, Santana L F, Vermulst M, et al. Overexpression of catalase targeted to mitochondria attenuates murine cardiac aging. Circulation, 2009, 119(21): 2789-2797.
19. Ge X, Cho A, Ciol M A, et al. Grip strength is potentially an early indicator of age-related decline in mice. Pathobiology of Aging & Age-related Diseases, 2016, 6(1): 32981.
20. Ge X, Ciol M A, Pettan-Brewer C, et al. Self-motivated and stress-response performance assays in mice are agedependent. Experimental Gerontology, 2017, 91: 1-4.
21. Goh J, Ladiges W. Voluntary wheel running in mice. Current Protocols in Mouse Biology, 2015, 5(4): 283-290.
22. Seibenhener M L, Wooten M C. Use of the open field maze to measure locomotor and anxiety-like behavior in mice. Journal of Visualized Experiments, 2015, 96: e52434.
23. Magnusson K R. Aging of glutamate receptors: correlations between binding and spatial memory performance in mice. Mechanisms of Ageing and Development, 1998, 104(3): 227-248.
24. Pettan-Brewer C, Touch D V, Wiley J C, et al. A novel radial water tread maze tracks age-related cognitive decline in mice. Pathobiology of Aging & Age-related Diseases, 2013, 3(1): 20679.
25. Wolf N, Pendergrass W, Singh N, et al. Radiation cataracts: mechanisms involved in their long delayed occurrence but then rapid progression. Molecular Vision, 2008, 14: 274.
26. Bürkner P C, Vuorre M. Ordinal regression models in psychology: A tutorial. Advances in Methods and Practices in Psychological Science, 2019, 2(1): 77-101.
27. Bürkner P C, Charpentier E. Modelling monotonic effects of ordinal predictors in Bayesian regression models. British Journal of Mathematical and Statistical Psychology, 2020, 73(3): 420-451.
28. Gelman A, Carlin J B, Stern H S, et al. Bayesian Data Analysis Chapman & Hall. CRC Texts in Statistical Science, 2004.
29. Vehtari A, Gelman A, Gabry J, Practical Bayesian model evaluation using leave-one-out cross-validation and WAIC. Statistics and Computing, 2017, 27(5): 1413- 1432.
30. Bürkner P C. Advanced Bayesian multilevel modeling with the R package brms. The R Journal, 2018, 10(1): 395–411
31. Vehtari A, Simpson D, Gelman A, et al. Pareto smoothed importance sampling. 2015, 1507: 02646.
32. Gelman A, Goodrich B, Gabry J, et al. R-squared for Bayesian regression models. The American Statistician, 2019.
33. Vehtari A, Gelman A, Simpson D, et al. Rank-normalization, folding, and localization:An improved R-hat for assessing convergence of MCMC. Bayesian Analysis, 2020, 1- 28.
34. Yao Y, Vehtari A, Simpson D, et al. Using stacking to average Bayesian predictive distributions (with discussion). Bayesian Analysis, 2018, 13(3): 917-1007.
35. Unlu O, Levitan E B, Reshetnyak E, et al. Polypharmacy in older adults hospitalized for heart failure. Circulation: Heart Failure, 2020, 13(11): e006977.
36. Biering-Sørensen T, Mogelvang R, Schnohr P, et al. Cardiac time intervals measured by tissue Doppler imaging M-mode: association with hypertension, left ventricular geometry, and future ischemic cardiovascular diseases. Journal of the American Heart Association, 2016, 5(1): e002687.
37. Biering-Sørensen T, Mogelvang R, Jensen J S. Prognostic value of cardiac time intervals measured by tissue Doppler imaging M-mode in the general population. Heart, 2015, 101(12): 954-960.
38. Schumacher A, Khojeini E, Larson D. ECHO parameters of diastolic dysfunction. Perfusion, 2008, 23(5): 291- 296.
39. Duggal N A, Niemiro G, Harridge S D R, et al. Can physical activity ameliorate immunosenescence and thereby reduce age-related multi-morbidity? Nature Reviews Immunology, 2019, 19(9): 563-572.
40. Klug J, Christensen S, Imai D M, et al. The geropathology of organ-specific aging. Journal of Translational Science, 2021.
41. Melis J P, Jonker M J, Vijg J, et al. Aging on a different scale–chronological versus pathology-related aging. Aging, 2013, 5(10): 782.
42. Salimi S. Perspective on multimorbidity and genetic theories of aging. Preprint, 2021.
43. Vijg J. From DNA damage to mutations: all roads lead to aging. Ageing Research Reviews, 2021, 101316.