Open Access | Research
This work is licensed under a Creative Commons Attribution-ShareAlike 4.0 International License.
Serum elementomic analysis indicates a panel of elements related with age
# These authors contributed equally to this work.
* Corresponding author: Wei Gao, M.D., Ph.D.
Mailing address: Department of Geriatrics, Zhongda Hospital,
School of Medicine, Southeast University, No.87 Dingjiaqiao,
Nanjing, Jiangsu Province, 210009, China.
Email: drweig1984@outlook.com
* Corresponding author: Xiang Lu, M.D., Ph.D.
Mailing address: Department of Geriatrics, Sir Run Run Hospital,
Nanjing Medical University, No.109 Longmian Avenue, Nanjing,
Jiangsu Province, 211166, China.
Email: luxiang66@njmu.edu.cn
Received: 13 December 2023 / Revised: 21 December 2023 / Accepted: 10 January 2024 / Published: 28 March 2024
DOI: 10.31491/APT.2024.03.134
Abstract
Background: Elementomics, which includes metallic and non-metallic elements, is an emerging and promising research field for human diseases. Researchers are focusing on discovering the relationship between elements and various diseases; however, the changes in element concentrations during the process of aging remain unclear.
Materials and Methods: We performed elementomic analysis in the serum of 70 subjects aged 30 to 96 years using inductively coupled plasma mass spectrometry. The subjects were divided into 7 groups with an age range of 10 years. Random forest was used to estimate the variable importance of elements. Linear regression model and restricted cubic spline analysis were performed to screen for elements individually associated with age. Candidate elements were combined by corresponding multivariate linear regression coefficients to generate a risk score representing their collective effect on age.
Results: Among the 62 detected elements, lithium, boron, calcium, titanium, and selenium were identified as the most important predictors of age. There was an increase in lithium and boron as well as a decrease in calcium and titanium with increasing age. The concentration of selenium was elevated before the age of 60, but decreased thereafter. A formula of element risk score was constructed using the respective coefficients from a multivariate linear regression model for the above five elements. The formula = 4.5522 × lithium + 6.0575 × boron - 4.9990 × calcium - 7.0403 × titanium - 0.8849 × selenium.
Conclusion: Elementomics could be a novel and promising non-invasive biomarker for the assessment of senescence.
Keywords
Elementomics, serum, age, inductively coupled plasma mass spectrometry
Introduction
Aging is an inevitable natural phenomenon characterized by a gradual, time-dependent decline in normal physiological
functions [1]. It is predicted that by 2050, the elderly population in China will
experience a significant surge, reaching up to 400 million individuals aged over 65 years and 150 million individuals aged
over 80 years [2, 3]. Biomarkers of aging
are quantifiable parameters that reflect both physiological and pathological aging [4].
To better understand the mechanisms of aging, recent studies have focused on the search for novel biomarkers of aging. In addition
to the identified aging-related substances and metabolites, such as total homocysteine in blood and 8-dihydroguanosine in
urine [5, 6], there has also been a growing
interest in investigating the effects of elements in the progression of aging.
Elementomics is the study of metals, metalloids and their relationships with genomes and proteomes [7].
Metal ions play an important role in regulating protein expression in cells, which is essential for maintaining cellular homeostasis
and facilitating detoxification processes [8]. Additionally, a substantial number of
protein enzymes rely on metal elements to facilitate their catalytic activities [9]. Current
perspectives on elements and disease are mainly concerned with cancer, Alzheimer's disease, Parkinson's disease, cardiovascular
disease, etc. [10]. Patients with Huntington's disease have been found to have
elevated circulating levels of iron, chromium, selenium, zinc, and arsenic, as well as decreased levels of antimony, lead, and
vanadium [11]. Zinc levels are decreased and cadmium levels are increased in patients
with prostate cancer [12-14]. In the
cardiovascular system, iron and calcium deficiencies have been identified to play a critical role in the development of heart
failure [15]. Previous studies have found that the levels of several elements are
increased in the aorta, blood, and other tissues of aged rats compared with young rats
[16-18]. Meanwhile, age-related differences in
elements have also been observed in the elderly population [19,
20]. However, few studies have investigated the relationship between elementomics and
the process of aging. The use of inductively coupled plasma mass spectrometry (ICP-MS) allows the rapid and accurate measurement
of more than 60 elements simultaneously [21, 22].
In the present study, we aimed to explore the changes in blood element concentrations in different age groups.
Materials and methods
Study population
The study population consisted of 70 subjects, aged 30 to 96 years, recruited from the Health Examination Center of Sir Run Run Hospital, Nanjing Medical University. The subjects were divided into 7 groups as a 10-year age range, with 5 males and 5 females in each group. Participants with the following conditions were excluded: (1) acute cardiopulmonary insufficiency; (2) severe renal insufficiency (creatinine clearance rate < 60 mL/min) or severe liver damage (transaminase levels more than twice the normal values); (3) malignant tumors; (4) gastrointestinal diseases; (5) acute or chronic inflammatory diseases; (6) eating disorders or malnutrition; (7) taking any kind of dietary supplements or trace elements before enrollment or during the study; (8) occupationally exposed to pollution or living in a polluted environment. The study was conducted in accordance with the tenets of the Declaration of Helsinki and was approved by the Ethics Committee of Sir Run Run Hospital, Nanjing Medical University (approval number 2019-SR-S041). Written informed consent was obtained from each participant.
Laboratory measurements
For hematologic and biochemical parameters, peripheral venous blood samples were collected after at least 8 hours of fasting. Blood samples were centrifuged at 3000 g for 10 minutes to separate the blood into serum and cell fractions within 2 hours. Serum samples were collected and stored at -80°C prior to further analysis. Fasting blood glucose (FBG), alanine transaminase (ALT), aspartate aminotransferase (AST), total bilirubin (TBil), serum creatinine (SCr), blood urea nitrogen (BUN), total cholesterol (TC), triglyceride (TG), high-density lipoprotein cholesterol (HDL-C), low-density lipoprotein cholesterol (LDLC), albumin (ALB), and globulin (GLOB) were measured using a chemistry analyzer (Olympus AU5400, Chemical Ltd., Japan).
Exposure assessment
Samples were thawed at 4℃ for approximately 1 hour, and then 100 μL of serum was diluted to 1.6 mL with 1% (v/v) HNO3, internal standards (including 40 ppb lithium, 20 ppb rhodium, 20 ppb indium, and 20 ppb rhenium), and 18 Ω deionized water. For the blank diluent, 100 μL of 18 Ω deionized water was used to replace the sample serum. Sixty-two elements in the serum were analyzed using the iCAP Qc ICP-MS system (Agilent 7700x ICP-MS, USA) of Shanghai Biotree Biotech Co., Ltd. The response of the calibration curve to the measured concentration was evaluated for goodness of fit. The R values of the correlation coefficients of the regression equations are all greater than 0.99, except for Ge, which was 0.98 (Table S1). The limit of detection (LOD) was calculated based on the average of 10 consecutive measurements of the blank diluent. Concentrations of elements below the LOD were imputed as LOD/2. Elements with a detection rate of less than 50% (wolfram and samarium) were categorized as "undetectable" (Table S2). Coefficients of variation varied with limits around 10% and met the required standards. All concentrations showed a right-skewed distribution and were loge transformed prior to statistical analysis.
Statistical analysis
Normality of distribution was assessed using the Kolmogorov-Smirnov test. Continuous variables were expressed as mean ± standard deviation or median [interquartile range (IQR)]. Differences between age groups were determined using the ANOVA test or the KruskalWallis test for continuous variables, depending on the data distribution. The chi-squared test was used to compare categorical variables presented as frequencies. To identify potential binary covariates, the enrolled participants were divided into two groups according to sex, alcohol consumption, smoking, hypertension, and cerebral infarction. Student t-test was used to compare the difference in age between the two groups. Conditional permutation for variable importance via random forest analysis was used to identify important elements most strongly associated with chronological age. Variables were ranked in descending order based on the importance score with higher scores indicating greater importance. A sliding window of nested random forest was used to calculate out-of-bag (OOB) errors. The element model with the minimum OOB error corresponded to a certain number of elements, which were selected for further analysis. Multivariate linear regression analysis was then performed to explore the potential linear relationship between the concentration of each element and age. Beta and 95% confidence intervals (CIs) were calculated. To further assess the potential nonlinear relationship of individual elements with age, restricted cubic spline was performed adjusting for covariates with 3 knots at the 25th, 50th, and 75th percentiles, with the value at the 50th percentile used as the reference. False discovery rate (FDR) was used to control for multiple comparisons, and P after FDR ≤ 0.05 was considered statistically significant. Pairwise interaction analyses of linear regression were performed to examine the correlations among 5 elements. Pearson correlation analysis was used to evaluate the relationships between selected elemental concentrations and laboratory indices. We also constructed an elemental risk score (ERS) to develop a potential approach for assessing elemental age. The ERS was calculated as the sum of the standardized concentrations of the selected elements multiplied by their respective coefficients. The formula was ERS = ∑KK=1 βkEk, where βk denotes the respective coefficient, Ek denotes the element standardized concentrations, and K denotes the number of elements. Statistical analyses were performed using R software, version 3.5.1 (The R Foundation for Statistical Computing) and SPSS 22.0 (IBM, Chicago, USA).
Results
Study participant characteristics
The demographic characteristics of the study population are shown in Table 1. Of the 70 participants, 35 (50.0%) were men and 35 (50.0%) were women. The mean age was 65.5 years and the median age was 65.2 years. There were no significant differences in sex, body mass index (BMI), smoking, and alcohol consumption among the different age groups. In contrast, the prevalence of hypertension and cerebral infarction was higher in subjects older than 70 years. Regarding biochemical parameters, the levels of ALB, A/G, and TC were lower in subjects older than 70 years. In addition, there were significant decreases in red blood cell (RBC), hematocrit (HCT), hemoglobin (Hb), and lymphocyte percentage (LYMPH) in subjects older than 80 years.
Table 1
Characteristics of the enrolled participants.
| Variables | 31–40 years old (n = 10) | 41–50 years old (n = 10) | 51–60 years old (n = 10) | 61–70 years old (n = 10) | 71–80 years old (n = 10) | 81–90 years old (n = 10) | 91–100 years old (n = 10) | P |
|---|---|---|---|---|---|---|---|---|
| Age, years | 38.0 (32.8–38.3) | 47.0 (45.8–47.3) | 54.5 (51.0–57.3) | 64.5 (63.0–66.5) | 74.0 (72.0–76.3) | 83.5 (81.8–84.0) | 92.5 (91.0–94.3) | 0.000 |
| Male, n (%) | 5 (50.0) | 5 (50.0) | 5 (50.0) | 5 (50.0) | 5 (50.0) | 5 (50.0) | 5 (50.0) | 1.000 |
| BMI, kg/m2 | 24.2 ± 2.9 | 22.9 ± 1.4 | 23.1 ± 2.5 | 22.9 ± 4.0 | 25.3 ± 2.5 | 22.1 ± 1.6 | 23.6 ± 4.3 | 0.275 |
| Smokers, n (%) | 2 (20.0) | 2 (20.0) | 2 (20.0) | 2 (20.0) | 0 (0) | 1 (10.0) | 0 (0) | 0.564 |
| Drinkers, n (%) | 3 (30.0) | 1 (10.0) | 2 (20.0) | 0 (0) | 0 (0) | 1 (10.0) | 1 (10.0) | 0.342 |
| Hypertension, n (%) | 1 (10.0) | 2 (20.0) | 4 (40.0) | 3 (30.0) | 6 (60.0) | 6 (60.0) | 9 (90.0) | 0.005 |
| Cerebral infarction, n (%) | 1 (10.0) | 2 (20.0) | 2 (20.0) | 4 (40.0) | 7 (70.0) | 7 (70.0) | 6 (60.0) | 0.014 |
| FBG, mmol/L | 5.02 ± 0.34 | 4.88 ± 0.59 | 5.35 ± 0.75 | 5.19 ± 0.67 | 5.27 ± 0.95 | 5.14 ± 0.95 | 4.73 ± 0.34 | 0.416 |
| ALT, U/L | 18.5 (12.5–25.5) | 15.1 (13.4–21.6) | 13.2 (11.2–24.7) | 15.8 (12.7–22.6) | 13.4 (11.6–16.7) | 15.7 (10.0–22.7) | 13.1 (9.0–20.5) | 0.741 |
| AST, UL | 19.8 (16.0–30.1) | 18.3 (15.8–22.5) | 18.1 (15.0–20.9) | 19.8 (18.0–23.2) | 18.7 (15.8–21.4) | 20.8 (17.3–26.2) | 23.8 (18.0–28.6) | 0.311 |
| TBil, μmolL | 7.7 ± 2.8 | 13.1 ± 3.6 | 11.6 ± 5.5 | 11.0 ± 5.0 | 10.9 ± 5.2 | 9.5 ± 6.1 | 10.8 ± 3.2 | 0.255 |
| SCr, μmol/L | 59.6 ± 13.1 | 63.9 ± 12.4 | 63.9 ± 12.3 | 60.5 ± 9.6 | 70.0 ± 15.7 | 78.2 ± 22.4 | 70.5 ± 17.6 | 0.099 |
| BUN, mmol/L | 4.49 ± 1.28 | 5.04 ± 1.25 | 5.04 ± 1.31 | 4.93 ± 0.61 | 5.94 ± 1.01 | 6.01 ± 1.77 | 5.07 ± 1.88 | 0.148 |
| TP, g/L | 77.5 (71.4–78.7) | 69.1 (65.9–76.3) | 72.9 (64.4–80.0) | 68.9 (63.8–78.6) | 71.5 (65.0–79.0) | 64.4 (62.5–70.1) | 67.1 (64.8–70.8) | 0.106 |
| ALB, g/L | 49.2 (47.9–50.8) | 47.1 (42.4–48.5) | 45.0 (40.8–50.9) | 44.7 (41.0–50.2) | 45.3 (42.9–46.4) | 40.2 (37.2–41.9) | 38.8 (34.8–41.5) | 0.000 |
| GLOB, g/L | 28.6 (23.9–29.6) | 22.7 (20.4–25.4) | 29.6 (27.8–40.8) | 25.2 (21.2–28.2) | 26.5 (23.4–29.1) | 26.5 (23.7–29.2) | 29.8 (24.3–32.7) | 0.008 |
| A/G | 1.70 (1.68–1.88) | 1.91 (1.78–2.23) | 1.80 (1.50–2.05) | 1.85 (1.60–2.11) | 1.70 (1.58–1.85) | 1.55 (1.42–1.71) | 1.25 (1.18–1.53) | 0.000 |
| TC, mmol/L | 4.38 (4.03–5.22) | 4.55 (4.24–4.96) | 5.25 (4.93–5.66) | 5.01 (3.97–6.42) | 4.52 (4.08–5.18) | 4.36 (4.11–4.66) | 3.91 (3.22–4.44) | 0.018 |
| TG, mmol/L | 1.22 (0.83–3.24) | 1.08 (0.70–1.53) | 1.11 (0.97–2.15) | 1.43 (1.08–1.96) | 1.01 (0.86–1.68) | 0.82 (0.73–1.28) | 0.99 (0.77–1.22) | 0.159 |
| LDL-C, mmol/L | 2.75 ± 0.71 | 2.91 ± 0.57 | 2.88 ± 0.68 | 2.81 ± 0.67 | 2.75 ± 0.57 | 2.44 ± 0.61 | 2.24 ± 0.60 | 0.183 |
| HDL-C, mmol/L | 1.51 ± 0.54 | 1.54 ± 0.49 | 1.87 ± 0.77 | 1.61 ± 0.62 | 1.53 ± 0.16 | 1.49 ± 0.21 | 1.37 ± 0.39 | 0.454 |
| UA, μmol/L | 316.2 (251.5–363.2) | 283.0 (209.3–361.4) | 337.8 (272.7–360.4) | 247.3 (228.9–301.1) | 299.5 (233.9–390.3) | 273.2 (244.8–334.6) | 306.6 (246.7–349.2) | 0.628 |
| WBC, 109 cells/L | 5.45 (5.16–6.76) | 5.31 (4.35–6.11) | 5.35 (4.55–5.80) | 5.14 (4.40–7.12) | 5.00 (4.60–6.13) | 5.86 (4.02–7.07) | 5.45 (4.23–7.19) | 0.911 |
| RBC, 109 cells/L | 4.60 (4.03–4.95) | 4.57 (4.21–4.68) | 4.41 (4.13–5.05) | 4.72 (4.55–4.84) | 4.78 (4.21–4.95) | 3.94 (3.52–4.31) | 3.82 (3.67–4.05) | 0.001 |
| HCT, L/L | 40.9 ± 3.6 | 41.2 ± 1.9 | 41.2 ± 5.0 | 41.9 ± 3.0 | 41.6 ± 3.4 | 37.0 ± 4.7 | 35.9 ± 2.4 | 0.001 |
| Hb, g/L | 137.5 (127.0–150.3) | 135.0 (130.8–144.5) | 142.5 (131.5–148.3) | 138.5 (127.3–141.5) | 141.5 (124.5–148.5) | 119.0 (109.5–132.5) | 121.0 (117.8–127.3) | 0.005 |
| PLT, 109 cells/L | 239.7 ± 49.1 | 187.3 ± 44.9 | 216.0 ± 75.5 | 224.1 ± 43.0 | 174.9 ± 55.8 | 189.7 ± 50.4 | 194.1 ± 50.2 | 0.097 |
| MONO, 109 cells/L | 0.34 ± 0.07 | 0.33 ± 0.07 | 0.36 ± 0.11 | 0.40 ± 0.08 | 0.35 ± 0.07 | 0.44 ± 0.11 | 0.61 ± 0.23 | 0.000 |
| MONO, % | 5.85 (5.33–6.90) | 6.80 (5.45–7.25) | 6.11 (5.48–7.51) | 7.20 (6.02–8.51) | 6.85 (6.28–7.41) | 7.30 (6.78–9.73) | 9.90 (9.28–11.10) | 0.000 |
| LYMPH, 109 cells/L | 1.83 ± 0.34 | 1.84 ± 0.42 | 1.94 ± 0.82 | 1.72 ± 0.55 | 1.49 ± 0.41 | 1.42 ± 0.66 | 1.45 ± 0.61 | 0.209 |
| LYMPH, % | 32.4 ± 7.3 | 35.5 ± 5.1 | 34.1 ± 8.0 | 31. 3± 9.6 | 29.2 ± 6.5 | 25.4 ± 7.6 | 25.5 ± 8.1 | 0.018 |
Note: A/G = albumin-globulin ratio; ALB = albumin; ALT = alanine transaminase; AST = aspartate aminotransferase; ASMI = appendicular skeletal muscle mass index; BMI = body mass index; BUN = blood urea nitrogen; CA-199 = carbohydrate antigen 199; FBG = fasting blood glucose; GLOB = globulin; Hb = hemoglobin; HCT = hematocrit; HDL-C = high-density lipoprotein cholesterol; LDL-C = low-density lipoprotein cholesterol; LYMPH = lymphocyte; MONO = monocyte; PLT = platelet; RBC = red blood cell; SCr = serum creatinine; TBil = total bilirubin; TC = total cholesterol; TG = triglyceride; TP = total protein; UA = uric acid; WBC = white blood cell.
Elementomics profiling
We quantified 62 elements by ICP-MS, including 5 alkali metals, 5 alkaline earth metals, 5 metalloids, 24 transition metals, 6 post-transition metals, 14 lanthanoids, 2 actinoids, and 1 other nonmetal (Figure 1A). The distributions of elemental exposure levels and the heatmap of different age groups are shown in Table S2 and Figure S1, respectively. OOB error analysis showed the top 13 elements that might be associated with age (Figure 1B-C). Further linear regression analysis and restricted cubic spline analysis identified 5 age-associated elements, including lithium (Li) [β (95 %CI) = 0.448 (14.02, 36.32), P < 0.001, Plinear FDR < 0.001], boron (B) [β (95 %CI) = 0.289 (3.04, 20.02), P = 0.009, Plinear FDR = 0.022], calcium (Ca) [β (95 %CI) = -0.271 (-189.72, -30.69), P = 0.007, Plinear FDR = 0.022], titanium (Ti) [β (95 %CI) = -0.332 (-49.44, -12.11), P = 0.002, Plinear FDR = 0.010] and selenium (Se) [β (95 %CI) = -0.296 (-38.12, -8.06), P = 0.003, Pnonlinear FDR = 0.008] (Table S3). With increasing age, the levels of Li and B increased, whereas the levels of Ca and Ti decreased (Figure 1D and Figure 2A-D). Interestingly, the concentration of Se was elevated before 60 years of age, but decreased thereafter (Figure 1D and Figure 2E). Concentrations of 5 identified elements in different age groups are presented (Table S4). The interaction analysis was performed to explore the possible interactive effects of Li, B, Ca, Ti, Se on the association with age. However, no significant correlation was observed among the above five elements (Table S5).
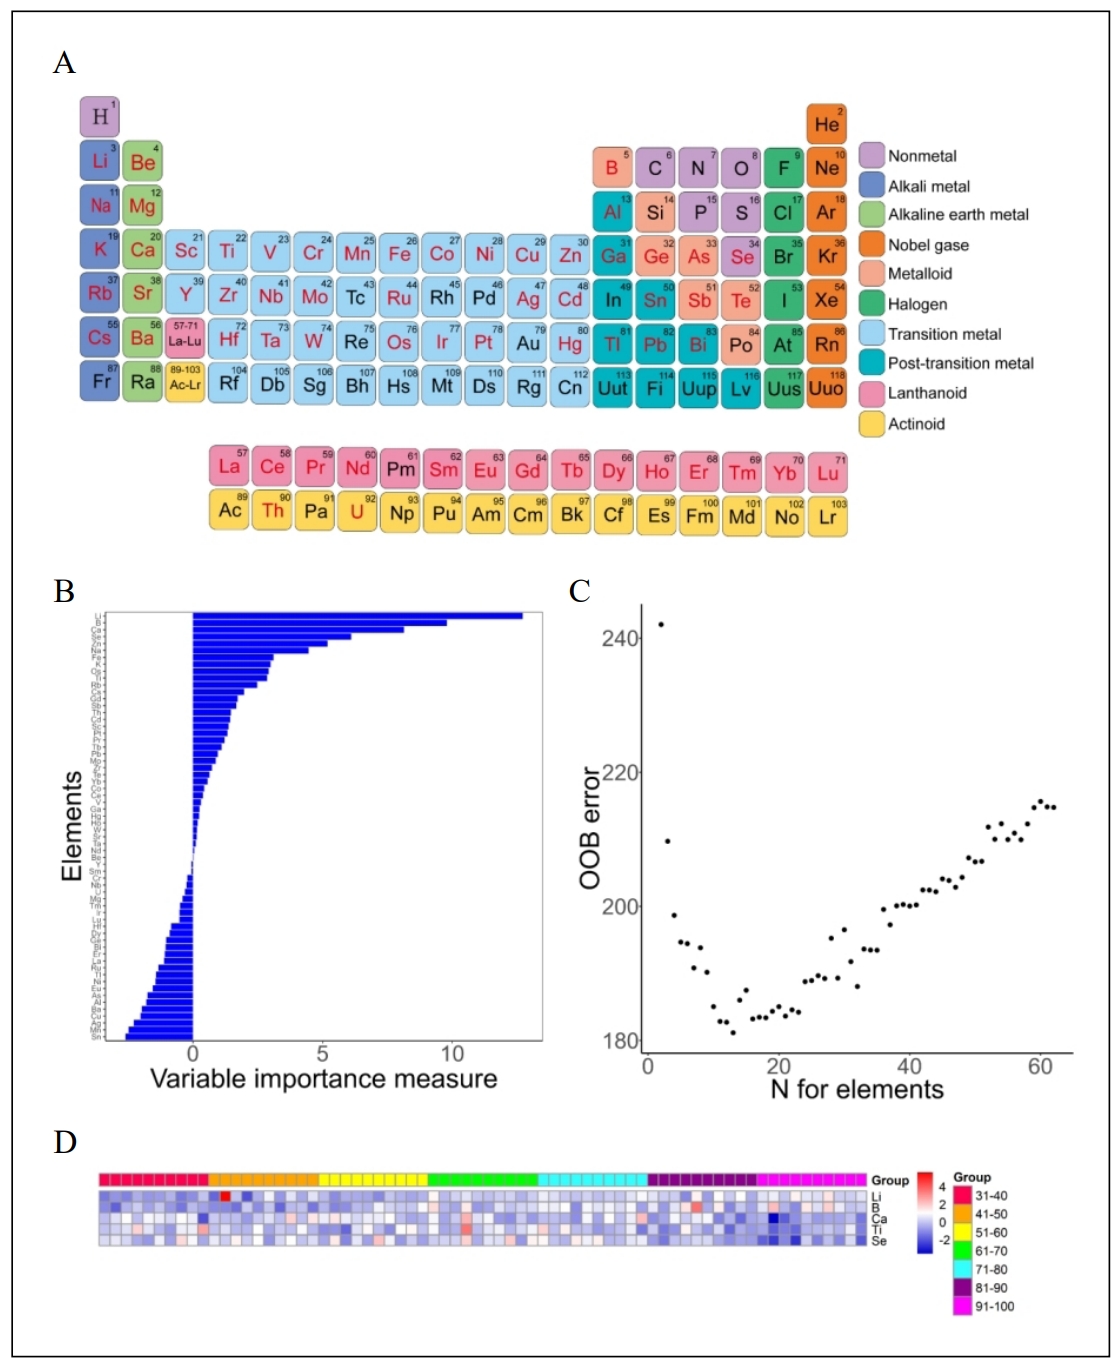
Figure 1. Periodic table of elements and elements identified by random forest. (A) Periodic table of elements, with detected elements marked in red. (B) Elements identified by random forest. The bar chart illustrates the variable importance measures of 62 elements. (C) The scatter plot illustrates the out-of-bag errors of the detected elements. The minimum OOB error corresponds to the first 13 elements. (D) Heatmap of 5 selected elements in different age groups.
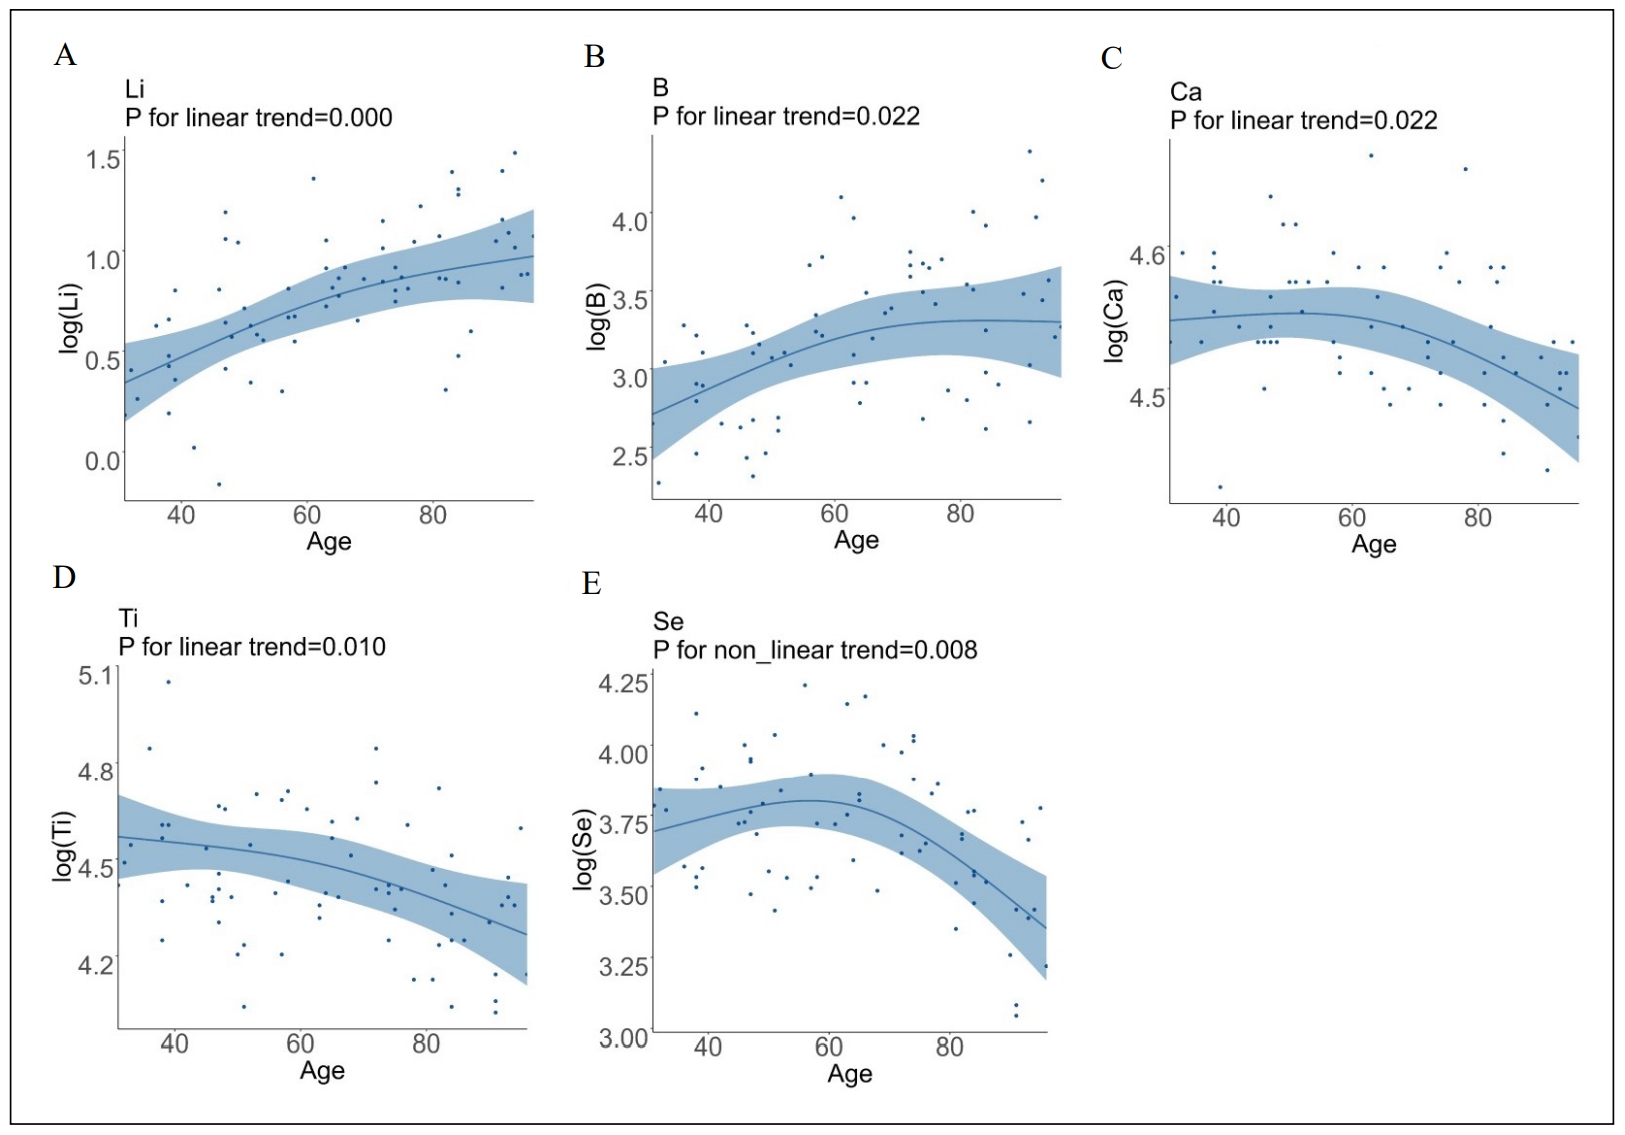
Figure 2. Relationship between age and concentrations of 5 identified elements. Multiple linear regression graphs and restricted cubic spline curves were used to analyze the correlation between age and concentration of Li (A), B (B), Ca (C), Ti (D), and Se (E).
Correlation between candidate elements and laboratory measurements
Pearson correlation analysis showed that the concentration of serum Ca was positively correlated with the levels of total protein (r = 0.584, P = 0.000), ALB (r = 0.551, P = 0.001). The concentration of serum Se was positively correlated with the level of HCT (r = 0.472, P = 0.020) (Table S6).
Construction of ERS
After fitting a multivariate linear regression between age and 5 candidate elements, the age prediction formula was established as the ERS. The ERS was calculated as the sum of the standardized concentrations of the selected elements multiplied by their respective coefficients (Table S7) as follows: ERS=4.5522 × Li + 6.0575 × B - 4.9990 × Ca - 7.0403 × Ti - 0.8849 × Se, which means that higher ERS represents older age.
Discussion
The identification of reliable biomarkers of aging is one of the major research goals in geroscience. Although numerous studies
have investigated the role of age-related biomarkers in degenerative diseases [23], the
relationship between elementomics and senescence has received little attention. To address this gap, our study measured
comprehensive serum elemental exposure profiles to investigate the association of elemental changes with age.
Aging is an inevitable process that affects all organisms over time and occurs at multiple levels, including the molecular,
cellular, organ, and organismal levels [24]. It has long been accepted that aging can be
attributed to the accumulation of reactive oxygen species (ROS), DNA damage, mitochondrial dysfunction, impaired antioxidant
defense, damaged autophagy process, loss of proteostasis, and telomere shortening, etc.
[25]. During the aging process, trace and macroelements, which are critical regulators
of metabolic and physiological pathways, are altered and can influence oxidative and inflammatory processes
[23, 26]. For example, some trace elements
(such as Se, Zn, Mn) have the ability to reduce oxidative damage or enhance repair capacity by acting as essential cofactors for
antioxidant enzymes and the different types of glutathione peroxidases, and therefore may play a crucial role in the
aging process [27, 28]. Our study identified 5
elements as the most important predictors of chronological age. Our analyses showed that 4 elements had a linear relationship
with age. Serum concentrations of Li and B appeared to be positively associated with increasing age, while Ca and Ti showed a
decrease with age. Se levels were elevated before 60 years of age and showed a decline thereafter. The highlight of this study is
that we constructed an integrated predictive model including Li, B, Ca, Ti, and Se to generate ERS, which could potentially serve
as a tool for predicting senility.
Essential trace elements and major elements play an indispensable role in maintaining human health by participating in various
metabolic processes and signaling pathways [29]. Among these elements, Se is a trace
element essential for several metabolic processes, including thyroid hormone metabolism, antioxidant defense systems, and immune
function [30]. Se is absorbed in the form of oranic (selenomethionine and selenocysteine)
or inorganic (selenate and selenite) by erythrocytes from the gastrointestinal tract and subsequently transported by plasma to
tissues and cells [31]. A previous study showed that serum selenium levels were
positively correlated with hematocrit (P <0.001, r = 0.215) in 1000 older adults
[32]. Consistently, we found that Se concentration was positively correlated with the
level of HCT, suggesting that the absorption of Se decreases with aging. Our results showed that Se concentration was increased
before 60 years of age, but decreased thereafter. One study reported that centenarians (91-110 years) had lower Se levels compared
with elderly subjects (60-90 years) [33]. However, another study showed that centenarians
(≥ 100 years) had much higher Se levels compared with elderly controls [34]. The
discrepancy may be attributed to the different comorbidity status between different study populations, as decreased Se levels have
been associated with cognitive decline and hyperglycemia in the elderly [35,
36]. Interestingly, a previous study found that Se concentration was increased in
the thyroids of old men, accompanied by a decrease in B and Li, indicating a redistribution of trace elements with aging
[37]. Therefore, these results may indicate the importance of Se supplementation at an
appropriate age with an appropriate dose. Further studies are needed to explore the exact effects and the underlying mechanism of
Se on the aging process.
Similar to Se, B is absorbed from the gastrointestinal tract and excreted in the urine [38].
Boron has been shown to be beneficial for bone growth and maintenance, central nervous system function, and regulation of
inflammatory response [39]. Our study found a positive correlation between aging and
serum B concentration. In men, serum B increased and reached a plateau between 50 and 69 years of age, followed by a gradual
increase after 70 years of age. In women, a gradual increase in serum B concentration was observed up to the age of 70 years. Our
results were consistent with previous studies showing a positive correlation between age and blood B levels
[40, 41]. Although studies have shown some
benefits of higher B status in the immune system, embryonic development, brain function, liver development, osteoporosis, cancer
therapy, and wound healing, high-dose boron showed opposite effects [38]. Therefore,
additional data are needed to elucidate the appropriate supplemental amount of B for human health as well as its mechanism of
action.
Li has been used for decades to treat mood disorders, including bipolar disorder, anxiety, and depression
[42]. A previous study in a Japanese population found that the concentration of Li in
drinking water was associated with lower mortality [43]. Here, we showed that Li levels
decreased with increasing age. Consistent with this, another study reported that younger subjects (mean age = 13.4 years) had a
lower brain-to-serum Li concentration ratio than adults (mean age = 37.3 years) with bipolar disorder, indicating a decrease in
serum Li in the adults [44]. Recent preclinical studies have shown that lithium can
protect against various forms of oxidative and xenobiotic stress, thereby extending the lifespan of fission yeast,
C. elegans, and drosophila [45-49].
However, the precise effects of Li as a biomarker and intervention for human aging need to be further confirmed.
As a heavy metal, Ti can enter the bloodstream from the respiratory and gastrointestinal tracts, as well as from
titanium-containing implants [50]. Once in the blood, Ti quickly dissociates and
transforms into titanium dioxide, which is then transported to various tissues throughout the body by a protein called serum
transferrin [51]. Within cells, Ti can increase the production of ROS, leading to
oxidative stress, apoptosis, and the induction of inflammation [52]. Accumulation of Ti
in the nervous system may contribute to pathological damage and the development of degenerative diseases, including Alzheimer's
disease and Parkinson's disease [53, 54].
In aged rats, titanium dioxide nanoparticles promoted the disruption of the blood-brain barrier, resulting in neuronal dysfunction
and cognitive impairment, suggesting a detrimental effect of increased Ti on the development of age-related diseases
[55]. However, here we found that Ti levels decreased with increasing age. In the body,
Ti is rapidly eliminated from the blood and accumulates in tissues with a highly perfused reticuloendothelial system, such as the
liver and spleen [56-58]. Therefore, we
hypothesized that decreased circulating Ti concentration may be attributed to increased ectopic accumulation of Ti in aging organs
such as the brain. Future studies are needed to investigate the distribution of Ti in the body and its effects on the function of
different organs during the aging process.
Ca plays a vital role in skeletal and muscle maintenance, hormone secretion, nerve impulse transmission, and vascular integrity
and activity [59]. Ca is mainly absorbed in the small intestine, and calcium homeostasis
is maintained by parathyroid hormone and calcitonin [60]. Ca2+ serves as a
multifunctional second messenger that fine-tunes a variety of physiological and pathological processes within the cell
[61]. Changes in Ca levels and the Ca2+ signaling pathway have also been
associated with accelerated aging [61]. A variety of senescence stimuli (oxidative
stress, telomere attrition, genotoxic agents, etc.) can stimulate Ca2+ influx through cell membrane calcium
channels [62-64]; however, along with
Ca2+ overload, inefficient coupling of mitochondrial respiration can result in the production of excess reactive oxygen
species, leading to mitochondrial damage, DNA damage, and ultimately apoptosis [63].
Several studies have suggested that serum 1,25(OH)2D levels decrease with age, accompanied by impaired Ca absorption,
leading to a defect in intestinal Ca absorption [65-67],
which may explain our finding of decreased serum Ca levels with age. In addition, our finding of a positive correlation between
calcium concentration and total protein as well as serum albumin is consistent with previous studies
[68]. Calcium supplementation has been recommended for the prevention of age-related
diseases such as osteoporosis [69]. However, the adverse effects of calcium
supplementation have also been reported, especially the formation of kidney stones [69].
Therefore, further studies are needed to explore the appropriate dosage of Ca that may have the ability of anti-aging.
There are several potential limitations to this study. First, the number of subjects was insufficient and limited to the area of
Jiangsu Province, which may limit the universality of the study results. To improve the quality of research, it is recommended to
increase the sample size and recruit people from different locations for further study. Second, our study did not take into account
the dietary structure, eating habits, nutritional status, and drinking water source of the participants, which may lead to
relatively inaccurate results. Therefore, a more comprehensive further study is needed to confirm our findings. Third, it was
difficult to exclude the possibility of causality bias due to the crosssectional nature of this study. In addition, due to the
complex biological and molecular mechanisms involved in aging, it may be difficult to identify a single biomarker as a valid
measure of healthy aging. Therefore, it is of utmost importance to conduct prospective studies to validate the effect of our ERS
model in reflecting aging. Finally, our findings were not externally validated. The ERS needs to be validated by future
well-designed experimental studies before it can be used as an indicator of aging in other studies.
Conclusions
This study identified five age-related elements in serum and constructed an ERS that may reflect the chronological age. Our findings emphasize the importance of assessing the changes in elements as well as their effects on the aging process.
Declarations
Funding
This work was supported by grants from the National Key Research and Development Plan of China (No. 2020YFC2008505 to Xiang Lu), the National Natural Science Foundation of China (No. 81970217 to Wei Gao and 81970218 to Xiang Lu), and the Jiangsu Commission of Health (No. LR2022004 and No. LKZ2023005 to Wei Gao).
Competing interests
The authors have no relevant financial or non-financial interests to disclose.
Author Contributions
Wei Gao and Xiang Lu conceived and designed the study. Kai-Yue Jia and Yan-Ru Li carried out the experiments. Hui-Xian Sun and Can Zhao analyzed and interpreted the data. Kai-Yue Jia and HuiXian Sun drafted the manuscript. Wei Gao, Xiang Lu, and Yan-Ru Li revised the manuscript. All authors read and approved the final version of the manuscript.
Data availability
The data will be available from the corresponding author upon reasonable request.
Ethics approval
The study was conducted in accordance with the tenets of the Declaration of Helsinki and was approved by the Ethics Committee of Sir Run Run Hospital, Nanjing Medical University (approval number 2019-SRS041).
Consent to participate
Informed consent was obtained from all individual participants included in the study.
References
1. Pal S, & Tyler JK. Epigenetics and aging. Sci Adv, 2016, 2(7): e1600584.[Crossref]
2. Fang EF, Scheibye-Knudsen M, Jahn HJ, Li J, Ling L, Guo H, et al. A research agenda for aging in China in the 21st century. Ageing Research Reviews, 2015, 24: 197-205. [Crossref]
3. Sun R, Cao H, Zhu X, Liu J-P, & Dong E. Current aging research in China. Protein & Cell, 2015, 6(5): 314-321. [Crossref]
4. Seals DR, Justice JN, & LaRocca TJ. Physiological geroscience: targeting function to increase healthspan and achieve optimal longevity. The Journal of Physiology, 2016, 594(8): 2001-2024. [Crossref]
5. Liang YD, Liu Q, Du MH, Liu Z, Yao SM, Zheng PP, et al. Urinary 8-oxo-7,8-dihydroguanosine as a potential biomarker of frailty for elderly patients with cardiovascular disease. Free Radic Biol Med, 2020, 152: 248-254. [Crossref]
6. Ahadi S, Zhou W, Schussler-Fiorenza Rose SM, Sailani MR, Contrepois K, Avina M, et al. Personal aging markers and ageotypes revealed by deep longitudinal profiling. Nat Med, 2020, 26(1): 83-90. [Crossref]
7. Mounicou S, Szpunar J, & Lobinski R. Metallomics: the concept and methodology. Chem Soc Rev, 2009, 38(4): 1119-1138. [Crossref]
8. Rono JK, Sun D, & Yang ZM. Metallochaperones: a critical regulator of metal homeostasis and beyond. Gene, 2022, 822: 146352. [Crossref]
9. Haraguchi H. Metallomics: the history over the last decade and a future outlook. Metallomics, 2017, 9(8): 1001-1013. [Crossref]
10. Jomova K, Makova M, Alomar SY, Alwasel SH, Nepovimova E, Kuca K, et al. Essential metals in health and disease. Chem Biol Interact, 2022, 367: 110173. [Crossref]
11. Squadrone S, Brizio P, Abete MC, & Brusco A. Trace elements profile in the blood of Huntington' disease patients. J Trace Elem Med Biol, 2020, 57: 18-20. [Crossref]
12. Yu HN, Shen SR, & Yin JJ. Effects of metal ions, catechins, and their interactions on prostate cancer. Crit Rev Food Sci Nutr, 2007, 47(8): 711-719. [Crossref]
13. Costello LC, & Franklin RB. A comprehensive review of the role of zinc in normal prostate function and metabolism; and its implications in prostate cancer. Arch Biochem Biophys, 2016, 611: 100-112. [Crossref]
14. Zimta AA, Schitcu V, Gurzau E, Stavaru C, Manda G, Szedlacsek S, et al. Biological and molecular modifications induced by cadmium and arsenic during breast and prostate cancer development. Environ Res, 2019, 178: 108700. [Crossref]
15. Jankowska EA, von Haehling S, Anker SD, Macdougall IC, & Ponikowski P. Iron deficiency and heart failure: diagnostic dilemmas and therapeutic perspectives. Eur Heart J, 2013, 34(11): 816-829. [Crossref]
16. Rakic A, Milovanovich ID, Trbovich AM, Stefanović S, Nikolić D, Janković S, et al. Trace elements in different tissues in aging rats. J Trace Elem Med Biol, 2020, 62: 126604. [Crossref]
17. Aydemir D, Salman N, Karimzadehkhouei M, Alaca BE, Turan B, & Ulusu NN. Evaluation of the effects of aging on the aorta stiffness in relation with mineral and trace element levels: an optimized method via custom-built stretcher device. Biological Trace Element Research, 2021, 199(7): 2644-2652. [Crossref]
18. Shimamura T, Iijima S, Hirayama M, Iwashita M, Akiyama S, Takaku Y, et al. Age-related effects of major and trace element concentrations in rat liver and their mutual relationships. J Trace Elem Med Biol, 2013, 27(4): 286-294. [Crossref]
19. Zeng HL, Li H, Lu J, Guan Q, & Cheng L. Assessment of 12 metals and metalloids in blood of general populations living in Wuhan of China by ICP-MS. Biol Trace Elem Res, 2019, 189(2): 344-353. [Crossref]
20. Kim HJ, Lim HS, Lee KR, Choi MH, Kang NM, Lee CH, et al. Determination of trace metal levels in the general population of Korea. Int J Environ Res Public Health, 2017, 14(7): 702-712. [Crossref]
21. Zhang P, Georgiou CA, & Brusic V. Elemental metabolomics. Brief Bioinform, 2018, 19(3): 524-536. [Crossref]
22. Laur N, Kinscherf R, Pomytkin K, Kaiser L, Knes O, & Deigner HP. ICP-MS trace element analysis in serum and whole blood. PLoS One, 2020, 15(5): e0233357. [Crossref]
23. Wagner KH, Cameron-Smith D, Wessner B, & Franzke B. Biomarkers of aging: from function to molecular biology. Nutrients, 2016, 8(6): 338-349. [Crossref]
24. Moskalev A, Guvatova Z, Lopes IA, Beckett CW, Kennedy BK, De Magalhaes JP, et al. Targeting aging mechanisms: pharmacological perspectives. Trends Endocrinol Metab, 2022, 33(4): 266-280. [Crossref]
25. da Silva PFL, & Schumacher B. Principles of the molecular and cellular mechanisms of aging. J Invest Dermatol, 2021, 141(4s): 951-960. [Crossref]
26. Khan SS, Singer BD, & Vaughan DE. Molecular and physiological manifestations and measurement of aging in humans. Aging Cell, 2017, 16(4): 624-633. [Crossref]
27. Méplan C. Trace elements and ageing, a genomic perspective using selenium as an example. J Trace Elem Med Biol, 2011, 25 Suppl 1: S11-16. [Crossref]
28. Lossow K, Kopp JF, Schwarz M, Finke H, Winkelbeiner N, Renko K, et al. Aging affects sex- and organ-specific trace element profiles in mice. Aging (Albany NY), 2020, 12(13): 13762-13790. [Crossref]
29. Baudry J, Kopp JF, Boeing H, Kipp AP, Schwerdtle T, & Schulze MB. Changes of trace element status during aging: results of the EPIC-Potsdam cohort study. European Journal of Nutrition, 2019, 59(7): 3045-3058. [Crossref]
30. Mojadadi A, Au A, Salah W, Witting P, & Ahmad G. Role for selenium in metabolic homeostasis and human reproduction. Nutrients, 2021, 13(9): 3256-3265. [Crossref]
31. Mehdi Y, Hornick JL, Istasse L, & Dufrasne I. Selenium in the environment, metabolism and involvement in body functions. Molecules, 2013, 18(3): 3292-3311. [Crossref]
32. He Y, Yu J, Yu N, Chen R, Wang S, Wang Q, et al. Association between the ratios of selenium to several elements and mild cognitive impairment in the elderly. Biol Trace Elem Res, 2023, 201(9): 4286-4297. [Crossref]
33. Savarino L, Granchi D, Ciapetti G, Cenni E, Ravaglia G, Forti P, et al. Serum concentrations of zinc and selenium in elderly people: results in healthy nonagenarians/centenarians. Exp Gerontol, 2001, 36(2): 327-339. [Crossref]
34. Alis R, Santos-Lozano A, Sanchis-Gomar F, Pareja-Galeano H, Fiuza-Luces C, Garatachea N,et al. Trace elements levels in centenarian ‘dodgers'. J Trace Elem Med Biol, 2016, 35: 103-106. [Crossref]
35. Akbaraly TN, Arnaud J, Rayman MP, Hininger-Favier I, Roussel AM, Berr C, et al. Plasma selenium and risk of dysglycemia in an elderly French population: results from the prospective epidemiology of vascular ageing study. Nutr Metab (Lond), 2010, 7: 21-33. [Crossref]
36. Akbaraly TN, Hininger-Favier I, Carrière I, Arnaud J, Gourlet V, Roussel AM, et al. Plasma selenium over time and cognitive decline in the elderly. Epidemiology, 2007, 18(1): 52-58. [Crossref]
37. Zaichick V, & Zaichick S. Associations between age and 50 trace element contents and relationships in intact thyroid of males. Aging Clin Exp Res, 2018, 30(9): 1059- 1070. [Crossref]
38. Khaliq H, Juming Z, & Ke-Mei P. The physiological role of boron on health. Biol Trace Elem Res, 2018, 186(1): 31- 51. [Crossref]
39. Nielsen FH. Micronutrients in parenteral nutrition: boron, silicon, and fluoride. Gastroenterology, 2009, 137(5 Suppl): S55-60. [Crossref]
40. Usuda K, Kono K, & Yoshida Y. Serum boron concentration from inhabitants of an urban area in Japan. Reference value and interval for the health screening of boron exposure. Biol Trace Elem Res, 1997, 56(2): 167-178. [Crossref]
41. Hasbahceci M, Cipe G, Kadioglu H, Aysan E, & Muslumanoglu M. Reverse relationship between blood boron level and body mass index in humans: does it matter for obesity? Biological Trace Element Research, 2013, 153(1): 141-144. [Crossref]
42. Fountoulakis KN, Tohen M, & Zarate CA, Jr. Lithium treatment of bipolar disorder in adults: a systematic review of randomized trials and meta-analyses. Eur Neuropsychopharmacol, 2022, 54: 100-115. [Crossref]
43. Zarse K, Terao T, Tian J, Iwata N, Ishii N, & Ristow M. Low-dose lithium uptake promotes longevity in humans and metazoans. Eur J Nutr, 2011, 50(5): 387-389. [Crossref]
44. Moore CM, Demopulos CM, Henry ME, Steingard RJ, Zamvil L, Katic A, et al. Brain-to-serum lithium ratio and age: an in vivo magnetic resonance spectroscopy study. Am J Psychiatry, 2002, 159(7): 1240-1242. [Crossref]
45. Sofola-Adesakin O, Castillo-Quan JI, Rallis C, Tain LS, Bjedov I, Rogers I, et al. Lithium suppresses Aβ pathology by inhibiting translation in an adult Drosophila model of Alzheimer's disease. Front Aging Neurosci, 2014, 6: 190- 200. [Crossref]
46. McColl G, Killilea DW, Hubbard AE, Vantipalli MC, Melov S, & Lithgow GJ. Pharmacogenetic analysis of lithiuminduced delayed aging in Caenorhabditis elegans. J Biol Chem, 2008, 283(1): 350-357. [Crossref]
47. Castillo-Quan JI, Li L, Kinghorn KJ, Ivanov DK, Tain LS, Slack C, et al. Lithium promotes longevity through GSK3/ NRF2-dependent hormesis. Cell Rep, 2016, 15(3): 638- 650. [Crossref]
48. Fries GR, Zamzow MJ, Colpo GD, Monroy-Jaramillo N, Quevedo J, Arnold JG, et al. The anti-aging effects of lithium in lymphoblastoid cell lines from patients with bipolar disorder and controls. Journal of Psychiatric Research, 2020, 128: 38-42. [Crossref]
49. Castillo-Quan Jorge I, Li L, Kinghorn Kerri J, Ivanov Dobril K, Tain Luke S, Slack C, et al. Lithium promotes longevity through GSK3/NRF2-dependent hormesis. Cell Reports, 2016, 15(3): 638-650. [Crossref]
50. Saxena M, Loza-Rosas SA, Gaur K, Sharma S, Pérez Otero SC, & Tinoco AD. Exploring titanium(IV) chemical proximity to iron(III) to elucidate a function for Ti(IV) in the human body. Coord Chem Rev, 2018, 363: 109-125. [Crossref]
51. Loza-Rosas SA, Saxena M, Delgado Y, Gaur K, Pandrala M, & Tinoco AD. A ubiquitous metal, difficult to track: towards an understanding of the regulation of titanium(iv) in humans. Metallomics, 2017, 9(4): 346-356. [Crossref]
52. Ma Y, Yu N, Lu H, Shi J, Zhang Y, Chen Z, et al. Titanium dioxide nanoparticles: revealing the mechanisms underlying hepatotoxicity and effects in the gut microbiota. Arch Toxicol, 2023, 97(8): 2051-2067. [Crossref]
53. Fu PP, Xia Q, Hwang H-M, Ray PC, & Yu H. Mechanisms of nanotoxicity: Generation of reactive oxygen species. Journal of Food and Drug Analysis, 2014, 22(1): 64-75. [Crossref]
54. Swiatkowska I, Martin N, & Hart AJ. Blood titanium level as a biomarker of orthopaedic implant wear. J Trace Elem Med Biol, 2019, 53: 120-128. [Crossref]
55. Disdier C, Chalansonnet M, Gagnaire F, Gaté L, Cosnier F, Devoy J, et al. Brain inflammation, blood brain barrier dysfunction and neuronal synaptophysin decrease after inhalation exposure to titanium dioxide nano-aerosol in aging rats. Sci Rep, 2017, 7(1): 12196. [Crossref]
56. Geraets L, Oomen AG, Krystek P, Jacobsen NR, Wallin H, Laurentie M, et al. Tissue distribution and elimination after oral and intravenous administration of different titanium dioxide nanoparticles in rats. Part Fibre Toxicol, 2014, 11: 30-42. [Crossref]
57. Fabian E, Landsiedel R, Ma-Hock L, Wiench K, Wohlleben W, & van Ravenzwaay B. Tissue distribution and toxicity of intravenously administered titanium dioxide nanoparticles in rats. Arch Toxicol, 2008, 82(3): 151-157. [Crossref]
58. Shinohara N, Danno N, Ichinose T, Sasaki T, Fukui H, Honda K, et al. Tissue distribution and clearance of intravenously administered titanium dioxide (TiO2) nanoparticles. Nanotoxicology, 2014, 8(2): 132-141. [Crossref]
59. Emkey RD, & Emkey GR. Calcium metabolism and correcting calcium deficiencies. Endocrinol Metab Clin North Am, 2012, 41(3): 527-556. [Crossref]
60. Li K, Wang XF, Li DY, Chen YC, Zhao LJ, Liu XG, et al. The good, the bad, and the ugly of calcium supplementation: a review of calcium intake on human health. Clin Interv Aging, 2018, 13: 2443-2452. [Crossref]
61. Madreiter-Sokolowski CT, Thomas C, & Ristow M. Interrelation between ROS and Ca(2+) in aging and age-related diseases. Redox Biol, 2020, 36: 101678. [Crossref]
62. Barbagallo M, Dominguez LJ, Licata G, & Resnick LM. Effects of aging on serum ionized and cytosolic free calcium: relation to hypertension and diabetes. Hypertension, 1999, 34(4 Pt 2): 902-906. [Crossref]
63. Ureshino RP, Rocha KK, Lopes GS, Bincoletto C, & Smaili SS. Calcium signaling alterations, oxidative stress, and autophagy in aging. Antioxid Redox Signal, 2014, 21(1): 123-137. [Crossref]
64. Ziegler DV, Vindrieux D, Goehrig D, Jaber S, Collin G, Griveau A, et al. Calcium channel ITPR2 and mitochondria–ER contacts promote cellular senescence and aging. Nature Communications, 2021, 12(1): 720-734. [Crossref]
65. Kinyamu HK, Gallagher JC, Balhorn KE, Petranick KM, & Rafferty KA. Serum vitamin D metabolites and calcium absorption in normal young and elderly free-living women and in women living in nursing homes. Am J Clin Nutr, 1997, 65(3): 790-797. [Crossref]
66. Kinyamu HK, Gallagher JC, Prahl JM, DeLuca HF, Petranick KM, & Lanspa SJ. Association between intestinal vitamin D receptor, calcium absorption, and serum 1,25 dihydroxyvitamin D in normal young and elderly women. J Bone Miner Res, 1997, 12(6): 922-928. [Crossref]
67. Nordin BE, Need AG, Morris HA, O'Loughlin PD, & Horowitz M. Effect of age on calcium absorption in postmenopausal women. Am J Clin Nutr, 2004, 80(4): 998- 1002. [Crossref]
68. Yang YY, Zhang D, Ma LY, Hou YF, Bi YF, Xu Y, et al. Association of famine exposure and the serum calcium level in healthy Chinese adults. Front Endocrinol (Lausanne), 2022, 13: 937380. [Crossref]
69. Cormick G, & Belizan JM. Calcium Intake and Health. Nutrients, 2019, 11(7): 1606-1612. [Crossref].
Supplementary
Table S1
Correlation coefficients in calibration curves.
| Element | Abbreviation | R | Element | Abbreviation | R | Element | Abbreviation | R |
|---|---|---|---|---|---|---|---|---|
| Lithium | 7Li | 0.9999 | Selenium | 78Se | 0.9993 | Gadolinium | 157Gd | 0.9999 |
| Beryllium | 9Be | 0.9994 | Rubidium | 85Rb | 0.9998 | Terbium | 159Tb | 0.9999 |
| Boron | 11B | 0.9996 | Strontium | 88Sr | 0.9995 | Dysprosium | 163Dy | 0.9999 |
| Sodium | 23Na | 0.9989 | Yttrium | 89Y | 0.9988 | Holmium | 165Ho | 0.9998 |
| Magnesium | 24Mg | 0.9990 | Zirconium | 90Zr | 0.9995 | Erbium | 166Er | 0.9997 |
| Aluminum | 27Al | 0.9991 | Niobium | 93Nb | 0.9813 | Thulium | 169Tm | 0.9998 |
| Potassium | 39K | 0.9999 | Molybdenum | 95Mo | 0.9994 | Ytterbium | 172Yb | 0.9999 |
| Calcium | 44Ca | 0.9994 | Ruthenium | 101Ru | 1 | Lutetium | 175Lu | 0.9998 |
| Scandium | 45Sc | 0.9995 | Silver | 107Ag | 0.9999 | Hafnium | 178Hf | 1 |
| Titanium | 47Ti | 0.9996 | Cadmium | 111Cd | 0.9990 | Tantalum | 181Ta | 0.9982 |
| Vanadium | 51V | 0.9986 | Tin | 118Sn | 0.9999 | Wolfram | 182W | 0.9998 |
| Chromium | 52Cr | 0.9998 | Antimony | 121Sb | 0.9997 | Osmium | 189Os | 1 |
| Manganese | 55Mn | 0.9998 | Tellurium | 125Te | 1 | Iridium | 193Ir | 1 |
| Iron | 56Fe | 0.9995 | Cesium | 133Cs | 1 | Platinum | 195Pt | 1 |
| Cobalt | 59Co | 0.9996 | Barium | 137Ba | 0.9998 | Hydrargyrum | 202Hg | 0.9996 |
| Nickel | 60Ni | 1 | Lanthanum | 139La | 0.9999 | Thallium | 205Tl | 0.9994 |
| Copper | 63Cu | 1 | Cerium | 140Ce | 0.9999 | Lead | 208Pb | 0.9999 |
| Zinc | 66Zn | 0.9996 | Praseodymium | 141Pr | 0.9999 | Bismuth | 209Bi | 0.9998 |
| Gallium | 71Ga | 0.9999 | Neodymium | 146Nd | 0.9999 | Thorium | 232Th | 1 |
| Germanium | 72Ge | 0.9784 | Samarium | 147Sm | 0.9999 | Uranium | 238U | 1 |
| Arsenic | 75As | 0.9999 | Europium | 151Eu | 0.9999 |
Table S2
Quality control and statistical summary of element exposure levels in serum samples.
| Abbreviation | Unit | LOD | N (%) of Conc.| RSD (%) |
Median (Q1–Q3) |
|
|---|---|---|---|---|---|
| 7Li | μg/L | 0.0004 | 0 | 1.25 | 2.255 (1.785-2.843) |
| 9Be | μg/L | 0.0005 | 5 (7.14%) | 1.17 | 0.020 (0.010-0.030) |
| 11B | μg/L | 0.4200 | 0 | 0.73 | 24.720 (17.238-34.703) |
| 23Na | mg/L | 0.3400 | 0 | 0.05 | 3260.000 (3167.000-3353.250) |
| 24Mg | μg/L | 0.0220 | 0 | 0.09 | 20883.500 (20148.250-21661.750) |
| 27Al | μg/L | 0.0280 | 0 | 1.71 | 116.210 (85.750-213.000) |
| 39K | mg/L | 1.7000 | 0 | 0.70 | 310.320 (173.752-513.530) |
| 44Ca | mg/L | 0.8100 | 0 | 0.05 | 93.331 (91.214-97.321) |
| 45Sc | μg/L | 0.0010 | 0 | 1.42 | 1.115 (0.708-1.693) |
| 47Ti | μg/L | 0.0140 | 0 | 0.25 | 82.314 (74.110-99.251) |
| 51V | μg/L | 0.0015 | 0 | 0.27 | 4.795 (3.663-5.913) |
| 52Cr | μg/L | 0.0110 | 0 | 1.42 | 2.385 (1.685-3.483) |
| 55Mn | μg/L | 0.0031 | 0 | 0.62 | 14.350 (6.508-21.581) |
| 56Fe | μg/L | 0.0810 | 0 | 0.39 | 1199.531 (827.243-1493.250) |
| 59Co | μg/L | 0.0006 | 1 (1.42%) | 0.55 | 0.171 (0.118-0.232) |
| 60Ni | μg/L | 0.0030 | 0 | 0.60 | 3.195 (2.703-4.185) |
| 65Cu | μg/L | 0.0055 | 0 | 0.18 | 997.521 (937.253-1120.511) |
| 66Zn | μg/L | 0.1500 | 0 | 0.37 | 917.21 (794.510-1070.250) |
| 71Ga | μg/L | 0.0005 | 2 (2.86%) | 0.77 | 0.050 (0.038-0.091) |
| 72Ge | μg/L | 0.0055 | 9 (12.85%) | 0.87 | 0.033 (0.010-0.060) |
| 75As | μg/L | 0.0025 | 8 (11.42%) | 1.02 | 0.432 (0.128-0.815) |
| 78Se | μg/L | 0.2500 | 0 | 0.24 | 41.322 (34.175-47.125) |
| 85Rb | μg/L | 0.0010 | 0 | 0.60 | 285.511 (182.752-419.250) |
| 86Sr | μg/L | 0.0008 | 0 | 0.24 | 42.623 (36.721-47.950) |
| 89Y | μg/L | 0.0002 | 6 (8.57%) | 0.97 | 19.422 (0.310-28.051) |
| 90Zr | μg/L | 0.0004 | 0 | 0.81 | 8.951 (3.420-17.230) |
| 93Nb | μg/L | 0.0017 | 0 | 0.73 | 0.620 (0.408-0.913) |
| 95Mo | μg/L | 0.0150 | 0 | 0.39 | 2.121 (1.623-2.725) |
| 101Ru | μg/L | 0.0013 | 7 (10.00%) | 0.77 | 0.020 (0.010-0.030) |
| 107Ag | μg/L | 0.0010 | 5 (7.14%) | 2.06 | 0.035 (0.021-0.080) |
| 111Cd | μg/L | 0.0010 | 1 (1.42%) | 0.62 | 0.070 (0.051-0.103) |
| 118Sn | μg/L | 0.0046 | 5 (7.14%) | 1.45 | 0.371 (0.132-3.695) |
| 121Sb | μg/L | 0.0007 | 0 | 0.41 | 4.923 (3.678-6.118) |
| 125Te | μg/L | 0.0300 | 12 (17.14%) | 0.89 | 0.515 (0.121-0.901) |
| 133Cs | μg/L | 0.0001 | 0 | 0.37 | 0.992 (0.831-1.293) |
| 137Ba | μg/L | 0.0019 | 0 | 0.71 | 5.661 (4.150-6.821) |
| 139La | μg/L | 0.0002 | 0 | 0.40 | 0.175 (0.148-0.223) |
| 140Ce | μg/L | 0.0003 | 0 | 0.39 | 0.312 (0.241-0.380) |
| 141Pr | μg/L | 0.0001 | 2 (2.86%) | 0.47 | 0.040 (0.030-0.051) |
| 146Nd | μg/L | 0.0003 | 0 | 0.44 | 0.145 (0.108-0.18) |
| 147Sm | μg/L | 0.0003 | 38 (64.29%) | 1.53 | 0 (0-0.020) |
| 151Eu | μg/L | 0.0001 | 10 (14.29%) | 0.78 | 0.010 (0.010-0.020) |
| 157Gd | μg/L | 0.0003 | 2 (2.86%) | 0.56 | 0.080 (0.050-0.120) |
| 159Tb | μg/L | 0.0001 | 8 (11.43%) | 0.72 | 0.010 (0.010-0.020) |
| 163Dy | μg/L | 0.0002 | 2 (2.86%) | 0.67 | 0.065 (0.040-0.113) |
| 165Ho | μg/L | 0.0001 | 7 (10.00%) | 0.74 | 0.020 (0.011-0.030) |
| 166Er | μg/L | 0.0004 | 5 (7.14%) | 0.67 | 0.050 (0.030-0.071) |
| 169Tm | μg/L | 0.0025 | 19 (27.14%) | 0.93 | 0.010 (0.001-0.011) |
| 172Yb | μg/L | 0.0002 | 1 (1.42%) | 0.63 | 0.040 (0.031-0.070) |
| 175Lu | μg/L | 0.0002 | 34 (48.57%) | 1.28 | 0.011 (0-0.012) |
| 178Hf | μg/L | 0.0001 | 0 | 0.86 | 2.580 (1.908-4.055) |
| 181Ta | μg/L | 0.0008 | 0 | 0.52 | 0.181 (0.140-0.255) |
| 182W | μg/L | 0.0030 | 48 (68.57%) | 2.77 | 0.002 (0.002-0.343) |
| 189Os | μg/L | 0.0004 | 0 | 2.08 | 0.025 (0.020-0.040) |
| 193Ir | μg/L | 0.0001 | 0 | 0.93 | 0.021 (0.020-0.033) |
| 195Pt | μg/L | 0.0005 | 1 (1.42%) | 0.73 | 0.080 (0.031-0.130) |
| 201Hg | μg/L | 0.0180 | 0 | 0.34 | 1.795 (1.580-2.201) |
| 205Tl | μg/L | 0.0005 | 0 | 1.73 | 0.300 (0.201-0.690) |
| 208Pb | μg/L | 0.0013 | 0 | 2.10 | 1.791 (1.365-2.325) |
| 209Bi | μg/L | 0.0002 | 0 | 1.45 | 0.065 (0.040-0.158) |
| 232Th | μg/L | 0.0003 | 0 | 1.73 | 0.435 (0.188-1.228) |
| 238U | μg/L | 0.0003 | 6 (8.57%) | 1.06 | 0.040 (0.010-0.061) |
Note: Conc: concentration; LOD: limit of detection, calculated as 3 times the average of 10 consecutive measurements of the blank diluent; RSD: relative standard deviation to evaluate stability of the measurements.
Table S3
Results of multiple linear regression analysis and restricted cubic spline regression of the association of age with elements.
| Element | β | 95%CI | P | Plinear FDR | Pnonlinear | Pnonlinear FDR |
|---|---|---|---|---|---|---|
| 1Li | 0.448 | (14.02, 36.32) | 0.000 | 0.000 | 0.183 | 0.362 |
| 3B | 0.289 | (3.04, 20.02) | 0.009 | 0.022 | 0.118 | 0.362 |
| 4Na | -0.168 | (-161.39, 13.74) | 0.097 | 0.140 | 0.153 | 0.362 |
| 7K | 0.216 | (0.67, 12.22) | 0.029 | 0.064 | 0.264 | 0.381 |
| 8Ca | -0.271 | (-189.72, -30.69) | 0.007 | 0.022 | 0.021 | 0.136 |
| 10Ti | -0.332 | (-49.44, -12.11) | 0.002 | 0.010 | 0.507 | 0.599 |
| 14Fe | -0.192 | (-18.09, 0.82) | 0.073 | 0.118 | 0.109 | 0.362 |
| 18Zn | -0.200 | (-30.69, 0.58) | 0.059 | 0.109 | 0.195 | 0.362 |
| 22Se | -0.296 | (-38.12, -8.06) | 0.003 | 0.013 | 0.001 | 0.008 |
| 23Rb | 0.130 | (-2.62, 11.86) | 0.207 | 0.270 | 0.572 | 0.620 |
| 35Cs | 0.085 | (-6.94, 17.01) | 0.404 | 0.437 | 0.227 | 0.368 |
| 43Gd | -0.105 | (-9.74, 3.1) | 0.305 | 0.361 | 0.379 | 0.492 |
| 54Os | -0.014 | (-3.65, 3.2) | 0.895 | 0.895 | 0.686 | 0.686 |
Note: Linear regression analysis and restricted cubic spline regression adjusted for three covariates including smoking, hypertension, and cerebral infarction.
Table S4
Concentrations of 5 identified elements in different age groups.
| Variables | 31–40 years old (n = 10) | 41–50 years old (n = 10) | 51–60 years old (n = 10) | 61–70 years old (n = 10) | 71–80 years old (n = 10) | 81–90 years old (n = 10) | 91–100 years old (n = 10) | P |
|---|---|---|---|---|---|---|---|---|
| Li, μg/L | 1.52 (1.28–1.89) | 2.07 (1.39–3.00) | 1.83 (1.65–1.98) | 2.37 (2.14–2.59) | 2.00 (2.25–2.92) | 2.37 (1.77–3.62) | 2.89 (2.42–3.39) | 0.451 |
| B, μg/L | 18.1 (13.5–22.9) | 14.3 (11.6–23.9) | 23.6 (19.1–31.0) | 26.5 (18.4–37.7) | 37.3 (27.2–39.7) | 29.5 (17.7–51.4) | 31.8 (23.6–56.5) | 0.047 |
| Ca, mg/L | 96.5 (93.0–98.3) | 93.5 (93.1–97.3) | 97.0 (92.8–97.5) | 94.1 (90.0–98.2) | 93.1 (91.8–98.3) | 91.5 (88.8–97.3) | 90.5 (86.5–92.3) | 0.010 |
| Ti, μg/L | 95.1 (82.2–106.8) | 82.5 (79.8–96.0) | 82.5 (67.1–108.5) | 93.5 (79.5–102.8) | 82.1 (75.3–103.5) | 73.3 (67.3–88.0) | 76.0 (61.8–81.3) | 0.051 |
| Se, μg/L | 43.2 ± 8.9 | 44.7 ± 6.7 | 42.7 ± 12.1 | 46.8 ± 10.7 | 46.0 ± 7.5 | 36.1 ± 4.9 | 30.9 ± 8.0 | 0.001 |
Table S5
Pairwise interaction of 5 identified elements.
| Element | Pinteraction |
|---|---|
| Li*B | 0.2869 |
| Li*Ca | 0.9687 |
| Li*Ti | 0.7234 |
| Li*Se | 0.666 |
| B*Ca | 0.7232 |
| B*Ti | 0.0676 |
| B*Se | 0.6741 |
| Ca*Ti | 0.4234 |
| Ca*Se | 0.1067 |
| Ti*Se | 0.7531 |
Table S6
Correlation between 5 identified elements and laboratory measurements.
| Element | Laboratory measurement | r | P value | P Bonferroni |
|---|---|---|---|---|
| Ca | TP, g/L | 0.584 | 0.000 | 0.000 |
| Ca | ALB, g/L | 0.551 | 0.000 | 0.001 |
| Se | HCT, L/L | 0.472 | 0.000 | 0.020 |
| Se | RBC, 109 cells/L | 0.440 | 0.000 | 0.076 |
| Ca | HCT, L/L | 0.441 | 0.000 | 0.081 |
| Ca | Hb, g/L | 0.430 | 0.000 | 0.123 |
| Ca | RBC, 109 cells/L | 0.415 | 0.000 | 0.211 |
| Se | MONO, % | -0.411 | 0.000 | 0.221 |
| Ti | Hb, g/L | 0.380 | 0.001 | 0.643 |
| Ca | MONO, % | -0.374 | 0.002 | 0.840 |
Note: ALB = albumin; r = correlation coefficient; Hb = hemoglobin; HCT = hematocrit; LYMPH = lymphocyte; MONO = monocytes; RBC = white blood cell; TP = total protein.
Table S7
Correlation between 5 identified elements and laboratory measurements.
| Element | β | 95%CI | P |
|---|---|---|---|
| Li | 4.552 | (0.99, 8.12) | 0.013 |
| B | 6.058 | (2.43, 9.67) | 0.001 |
| Ca | -4.999 | (-8.29, -1.71) | 0.004 |
| Ti | -7.040 | (-10.43, -3.65) | 0.001 |
| Se | -0.885 | (-4.37, 2.60) | 0.613 |
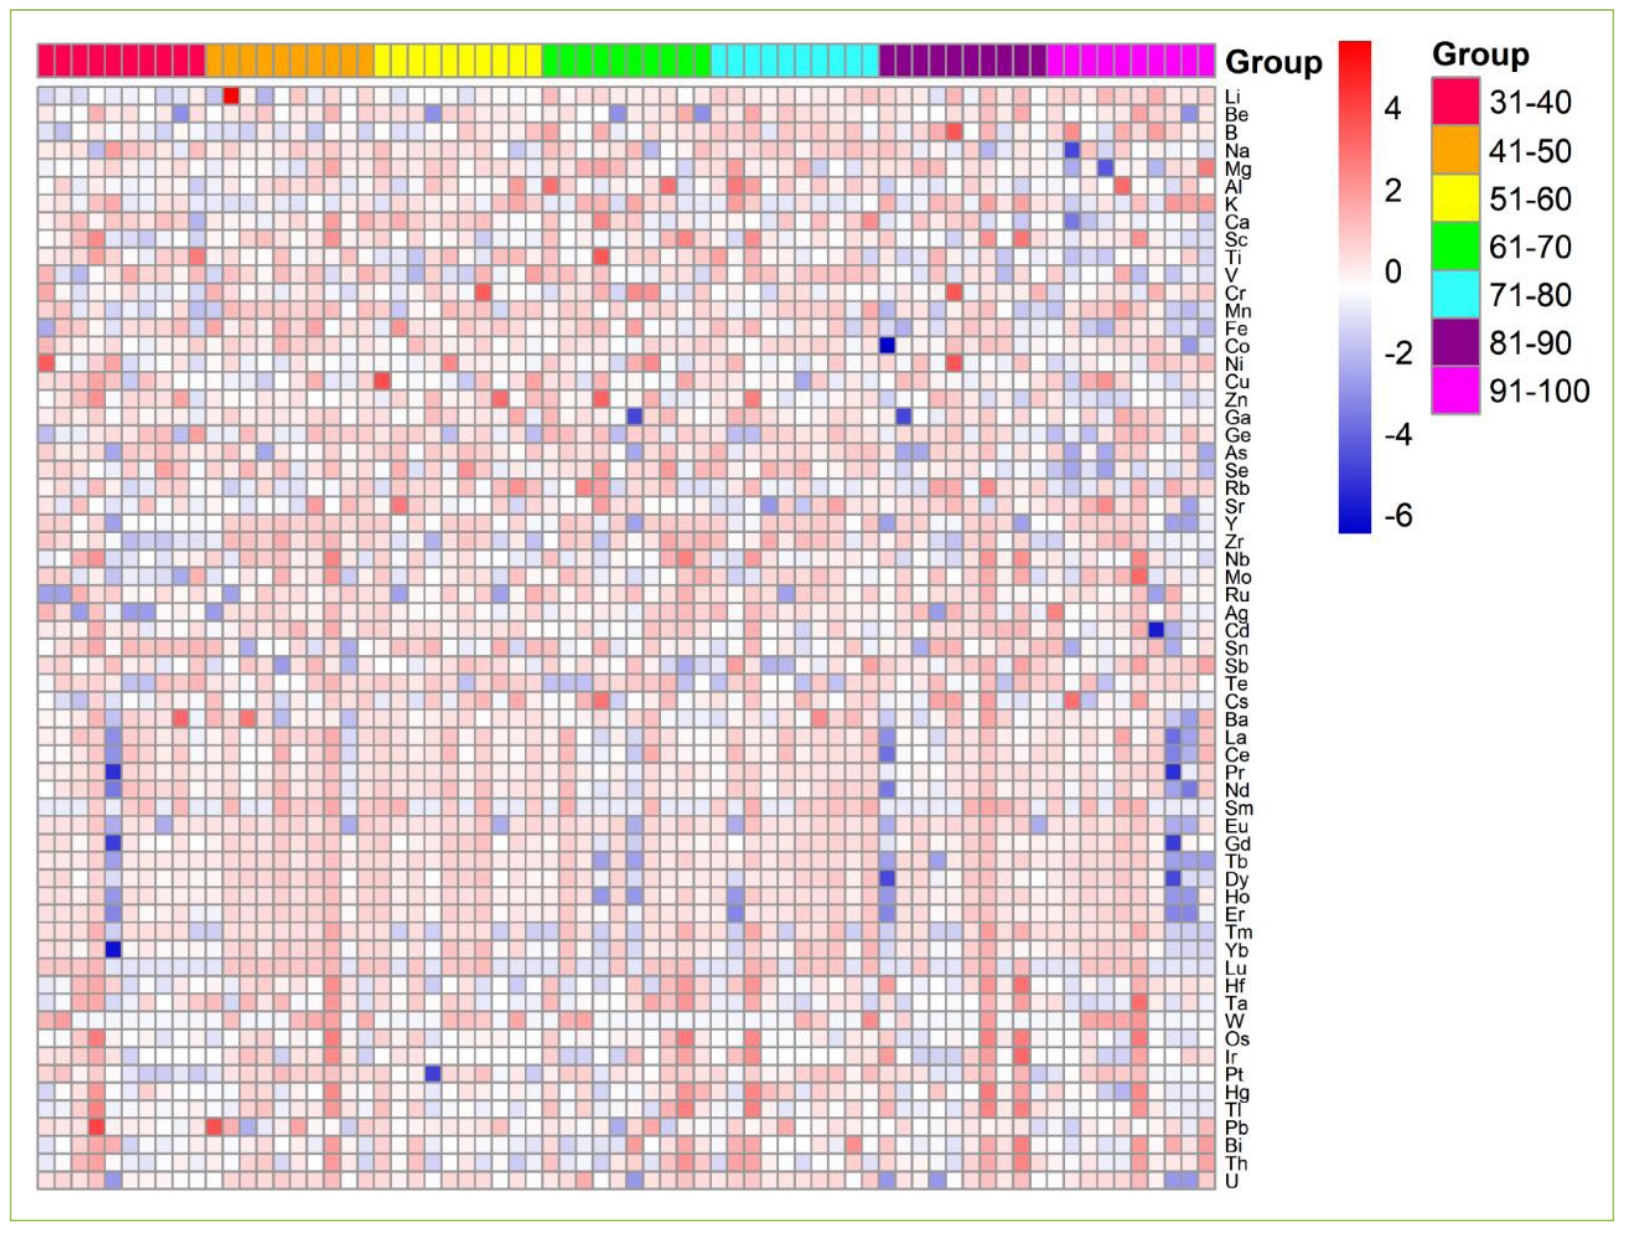
Figure S1. Heatmap of detected elements. Participants were divided into 7 groups as 10 years span of age.