Open Access | Research
This work is licensed under a Creative
Commons Attribution-ShareAlike 4.0 International License.
Effects of mitochondrial fusion and fission regulation on mouse hippocampal primary cultures: relevance to Alzheimer's disease
* Corresponding author: Alina Vadimovna Chaplygina
Mailing address: Institute of Cell Biophysics, Russian Academy of Sciences—a Separate Division of Federal Research Center
Pushchino Research Center for Biological Studies, Russian Academy of Sciences, Pushchino, Moscow region, 142290 Russia.
Email: shadowhao@yandex.ru
This article belongs to the Special Issue: Ever evolving hallmarks of aging
Received: 04 February 2024 / Revised: 04 March 2024 / Accepted: 14 March 2024 / Published: 28 March 2024
DOI: 10.31491/APT.2024.03.132
Abstract
Background: Alzheimer's disease (AD) is a complex disease that begins long before the first well-known pathophysiological signs appear and requires, among other things, new diagnostic approaches. This is mainly due to the lack of an effective treatment due to the lack of understanding of the disease mechanisms and the absence of correct biological models reflecting the cause-and-effect relationships in pathogenesis. One of the dysfunctional changes in AD is the disruption of mitochondrial fission and fusion processes.
Materials and methods: In this study, mitochondrial fusion and fission were regulated in primary neuro-astrocytic cultures of mouse hippocampus using mitochondrial fission inhibitor, mitochondrial fusion promoter and exogenous zinc. Changes in mitochondrial and cellular morphology were assessed, as well as lipofuscin levels as an early marker of mitochondrial dysfunction. Primary neuro-astrocytic hippocampal cultures from 5xFAD mice, a model of hereditary AD, were used for comparison.
Results: Use of the mitochondrial fusion promoter converts the mitochondrial network into a pool of fused mitochondria and results in a decrease in neuronal density by day 5 of exposure, with a concomitant decrease in astrocyte density by days 1 and 5 of exposure, accompanied by a decrease in lipofuscin fluorescence intensity in culture. The use of mitochondrial fission inhibitor resulted in the appearance of fused mitochondria and the disappearance of the pool of smallest mitochondria. This was accompanied by a decrease in neuronal density and an increase in astrocyte density with a concomitant increase in lipofuscin fluorescence intensity to the level of 5xFAD culture. Exogenous zinc induces mitochondrial fragmentation and at high concentrations leads to compensatory astrogliosis and neurodegeneration, while at low concentrations it decreases lipofuscin fluorescence intensity and affects culture morphology and changes in astrocyte immunoreactivity to GFAP.
Conclusion: The study demonstrates that changing the processes of mitochondrial dynamics affects the morphology of adult cell cultures and can lead to processes similar to those observed in 5xFAD transgenic cultures
Keywords
Mitochondria, mitochondrial fusion and fission, 5xFAD, lipofuscin, Alzheimer's disease, primary hippocampal culture
Introduction
Alzheimer's disease (AD) is one of the most common neurodegenerative diseases associated with cognitive impairment and
progressive neuronal loss. Currently, there is no doubt that mitochondria are involved in the pathogenesis of AD, and some
hypotheses place mitochondrial dysfunction in the leading role in the onset of AD [1,
2]. Decreased respiratory capacity, increased mitochondrial fragmentation, and fractures
in the mitochondrial cristae structure occur in the brain in AD, and abnormalities in mitochondria appear before the deposition of
pathologic Aβ plaques [3]. Consistent with the observation that impaired energy metabolism
invariably precedes the clinical onset of AD, mitochondrial dysfunction has been established as an early and prominent feature of
the disease [4]. Cell functionality is highly dependent on the state of the mitochondria,
which are essential for ATP production (general support of cell metabolism) and maintaining calcium homeostasis (regulation of
neurotransmitters and communication with other cells). There are different fractions of mitochondria in different parts of the cell
at the same time, performing different functions. These fractions must be in constant turnover to maintain the normal physiological
state of the cell. This form of mitochondrial dynamics is known as mitochondrial fission and fusion
[5]. Under normal conditions, mitochondrial fusion and fission occur continuously. A
constant balance is maintained between mitochondria in the fusion-fission process, which deviates from one side to the other in
response to the energy and metabolic needs of the cell.
Improper mitochondrial function leads to the formation of lipofuscin (Figure 1). It is a
substance composed of oxidized lipids, covalently cross-linked proteins, oligosaccharides, and metals. The composition of
lipofuscin is largely dependent on the intracellular site of action of reactive oxygen species on proteins and lipids
[6]. Lipofuscin accumulation is directly proportional to pathologies of various genesis
and also increases under conditions of oxidative stress and reactive oxygen species produced by damaged mitochondria. Although
lipofuscin is considered a marker of senescent cells, recent work shows its close association with pathologic tau protein and Aβ
in AD [7, 8]. Moreover, a recent study shows
that the α-structured protein lipofuscin is a toxic component of β-structured amyloid plaques
[9]. Since lipofuscin has the property of autofluorescence, it can be used as a marker
of disorders even before the first morphologic manifestations. That said, one of the most common descriptions of lipofuscin
sounds like "intracellular trash". This term denotes one of the interesting properties of lipofuscin—extreme resistance to
cellular proteolysis, which is explained by the "cross-linking" of the aldehyde and amino groups of the peptide to form stable
polymeric structures.
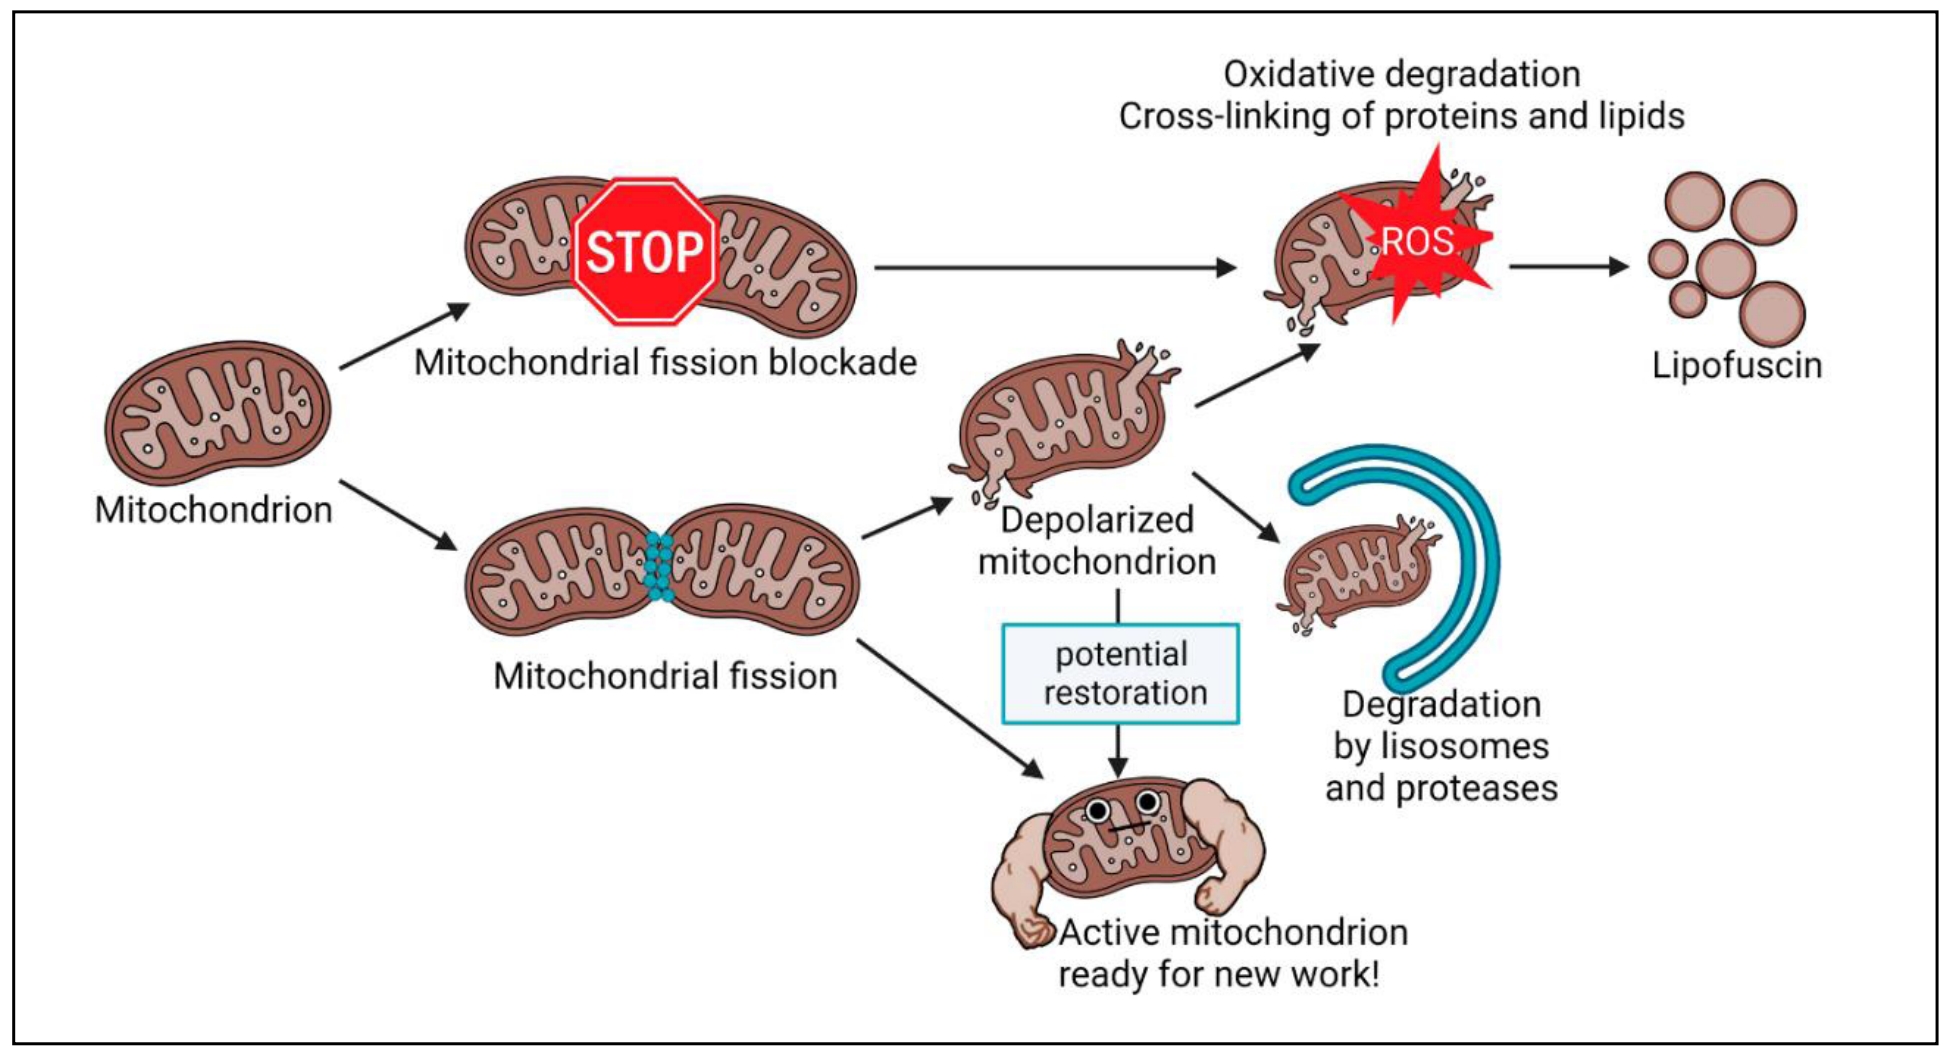
Figure 1. Mechanism of lipofuscin formation from mitochondria.
The search for a model of sporadic AD is incomplete, mainly due to the inability to understand and reproduce the mechanism of
disease development. This leads researchers to the fact that one obvious imbalance process is reproduced in models (disturbance of
the balance in the systems of generation and detoxification of reactive oxygen species in rats of the OXYS line
[10], mice with surgically removed olfactory bulbs (olfactory bulbectomized mice)
[11] or direct introduction of pathological tau protein or beta-amyloid into the culture
of neurons [12, 13].
In this work, we sought to investigate whether disruption of mitochondrial dynamics in healthy cultures could lead to a process
similar to the pathology manifested in the 5xFAD mouse line. We directly manipulate the mitochondrial fusion-division system in
primary mixed neuroastrocyte hippocampal cultures of mice by inducing shifts toward a prevalence of fusion or fission. We used the
primary hippocampal cell culture of 5xFAD transgenic mice for comparison. Cells in the transgenic culture gradually accumulate
high levels of the neurotoxic agent betaamyloid from the beginning of their lives, causing neurodegeneration similar to AD
[14]. In addition to the formation of amyloid plaques, it is characterized by marked
astrogliosis and loss of neuronal and synaptic density, as well as increased levels of lipofuscin, an early marker of cellular
pathology [15]. Altering the balance of fusiondivision processes in native primary cell
cultures of the hippocampus creates conditions in which an already adult neuronal culture without pathologies encounters a forced
disturbance of cellular homeostasis. In 5xFAD mice, it is amyloid overproduction that triggers a cascade of reactions affecting
cellular and subcellular morphology, mimicking the processes typically seen in AD.
Materials and methods
Animal models
The work was performed on animals that are a model of AD: transgenic mice of the 5XFAD (TG6799) line and healthy littermates.
Cells in the transgenic culture gradually accumulate high levels of the neurotoxic agent betaamyloid, which causes
neurodegeneration in AD, from the beginning of their lives. Mice of the 5xFAD line were obtained on a congenic SJL/C57B16
background to minimize concerns related to allelic segregation and high variability in the original hybrid background. The 5xFAD
transgenic mice overexpress the following five FAD mutations: the APP (695) transgene contains the Swedish (K670N, M671L),
Florid (I716V), and London (V7171) mutations, and the PSEN1 transgene contains the M146L and L286V mutations. Expression of both
transgenes is regulated by murine Thy1 promoter elements to drive their overexpression specifically in neurons. The transgenes are
inserted into a single locus Chr3:6297836 where they do not affect any known genes. Animals were kept in a specialized vivarium
with free access to water and standardized feed at 22-24°C and natural light. Laboratory animals were treated in accordance with
the European Convention for the Protection of Vertebrates used for Experimental and Other Purposes (Strasbourg, 1986) and the
principles of the Helsinki Declaration (2000). All animal procedures performed with mice were approved by the Committee on
Biosafety and Bioethics (Institute of Cell Biophysics—Pushchino Scientific Center for Biological Research of the Russian Academy
of Sciences) in accordance with Directive 2010/63/EU of the European Parliament.
To establish groups of animals for breeding, mice were genotyped by classical PCR using DNA isolated from ear biopsy specimens.
The presence of a Tg cassette of 377 bp in length was detected using primers 5'-AGG ACT GAC CAC TCG ACC AG-3' and 5'-CGG GGG TCT
AGT TCT GCA T-3', followed by electrophoretic visualization. Newborn mice are subjected to a second genotyping to validate their
transgenicity.
Primary culture of brain hippocampus
Mice (aged 0-1 day) were decapitated using a special guillotine for instant and humane slaughter of laboratory rodents. The hippocampus was mechanically crushed and treated with trypsin-EDTA solution (Gibco, USA). The cell suspension obtained by enzymatic and mechanical dissociation was then added to the wells of a 12-well plate coated with poly-D-lysine support substrate (Gibco, USA) or slides, cells were added to 2 or 1 mL Neurobasal Medium (Gibco, USA) containing 2% B-27 supplement (Gibco, USA) and 1% penicillin-streptomycin-glutamine (Gibco, USA), respectively. Half of the medium was replaced with fresh medium every five days. Cells were cultured in a CO2 incubator at 37°C and 5% CO2 until the required time. Thus, we obtained both control transgenic (Tg) and non-transgenic (nTg) cultures from the hippocampi of littermate animals. Cultures at 14 days of age were used in the experiments. At this term transgenic cultures already reproduce such characteristic features of AD as a decrease in neuronal density on the background of an increase in astrocyte density, a decrease in the number of synaptic contacts, as well as a significant increase in the concentration of beta-amyloid.
Regulation of mitochondrial fusion and fission processes
Two substances with similar functions but different pathways were selected for mitochondrial fusion shifts. The first substance,
Mitochondrial Division Inhibitor 1 (Sigma-Aldrich 475856) (mdivi-1), is a cell-permeable quinazolinone compound that reversibly
inhibits dynamin-like proteins (Drp1) (dynamin-related GTPases) responsible for mitochondrial fission. The second substance:
Mitochondrial Fusion Promoter M1 (Sigma-Aldrich SML0629) (MFP), is a cell-permeable hydrazone that enhances mitochondrial fusion
and does not affect the morphology of the endoplasmic network and lysosomes. Preparation of solutions of substances and application
into wells was performed according to the manufacturer's recommendations. In our experiments, we used short (1 day) and long
(5 days) observations after Mdivi-1 and MFP administration to evaluate the response and dynamics of changes in the structure of the
primary hippocampal culture over time.
Forcing mitochondrial fission seemed to be a much more difficult task. Currently, the commercial market is unable to provide
compounds capable of directly affecting mitochondrial fission processes. In our experiments, we used the introduction of zinc
chloride solution at high (1 μM) and low (0.1 μM) concentrations into the cultures. Since "overloading" the culture cells with zinc
causes too much cellular and mitochondrial stress, which directly affects both mitochondrial and culture morphology, this
experiment was performed within a single day. The concentration we chose allowed for effects on mitochondrial morphology without
causing immediate cytotoxicity, which is primarily reflected in the integrity of the neurite structure. This experiment reflects a
short (1 day) and a long (5 days) follow-up.
Visualization of mitochondria
To visualize mitochondria in cells, we used transduction/transfection of cell cultures with the CellLight BacMam 2.0 Red System. This ready-to-use construct is transduced/transfected into cells using BacMam 2.0 technology, where it expresses a fluorescent protein fused to the E1 alpha-pyruvate dehydrogenase leader sequence. An appropriate volume of reagent is injected into a cell culture of desired density (reagent calculation is based on the number of cells in the culture according to the manufacturer's recommendations) and gently mixed. The cells are returned to the culture incubator overnight and after approximately 16 hours the culture is ready for experiments. Mitochondrial morphology was examined using a Leica DM IL LED microscope (Leica, Germany) with a ×100 oil immersion objective. We found that the fixation of nerve cells disrupts mitochondrial morphology and triggers an immediate cascade of mitoptosis reactions with the displacement of mitochondrial material along with fluorescent agents from the cell, which is especially noticeable when working with astrocytes. Therefore, all mitochondrial morphology data were obtained from live, unfixed cell cultures.
Detection of intracellular lipofuscin
We also used spectrofluorimetric detection of lipofuscin, an autofluorescent aging pigment, as a marker of changes in cellular
metabolism. For this purpose, culture plates containing primary hippocampal cultures were washed three times with PBS and poured
into a solution of 5% sodium dodecyl sulfate in water for 5 minutes with simultaneous stirring on a shaker equipped with a
refrigerant, which allowed to completely destroy cell cultures and transfer them into solution. The resulting suspensions were
frozen and used for further experiments. Sodium dodecyl sulfate disintegrates protein complexes and destroys cell membranes, but
does not destroy lipofuscin due to its N-substituted imines-Schiff bases. The addition of detergent in our experiments, in addition
to chemical dissociation, reduced light scattering and eliminated the effect of Tyndall-Rayleigh hypochromism, directly affecting
the registration of spectral features.
The protein concentration in the obtained suspensions was determined and equilibrated by the Lowry method and the UV-express method
by the optical density of tryptophan protein in the ultraviolet at 286 nm [16]. UV
spectroscopy methods are based on the ability of solutions to absorb light at about 280 nm due to the presence of the amino
acids tryptophan, tyrosine, and phenylalanine in proteins. Detection results are directly proportional to the content of these
amino acids in proteins. To obtain reliable and accurate results, the optical density values of the solutions must meet the
requirements of linearity over the range of protein concentrations to be determined.
Lipofuscin formation was detected by a characteristic fluorescence band at about 450 nm under excitation at a wavelength of 360
nm. Lipofuscin content in homogenates was determined using a Perkin Elmer MPF-44B spectrofluorimeter (USA) in multiway mirror
microcuvettes for measuring the fluorescence of weakly absorbing solutions. The cuvettes provide multiple enhancements of
fluorescence intensity due to the increased optical path length of the excitation light and the added light collection of the
emission. The excitation light enters through a narrow window in the front mirror wall of the cuvette, passes through the solution
to the opposite side of the mirror, is deflected, and undergoes two or three reflections within the cuvette. The radiation is
collected at right angles. Additional light collection of radiation is provided by a side wall of the mirror that directs the
fluorescence into the registration channel. When used, light loss and artifact polarization are minimal compared to a conventional
cuvette placed near concave mirrors.
Immunocytochemistry
For immunocytochemical staining for neuronal and astrocyte markers, cell cultures were fixed with 4% paraformaldehyde for 10 minutes. Membrane permeability was then increased with 0.2% Triton X-100 solution, and non-specific binding to antigens was blocked for 1 hour at room temperature in PBST (PBS + 0.1% Tween 20) + 1% BSA solution with 10% normalized donkey serum (Abcam, ab7475) and 5% normalized goat serum (Invitrogen, 31872). The cultures were left overnight at 4°C for incubation with primary antibodies. After incubation with primary antibodies, binding was performed with appropriate secondary antibodies conjugated to fluorescent tags for 2 hours at room temperature. After each treatment, the cells were washed 3 times with PBS solution (pH 7.4) for 5 minutes each. The following primary and secondary antibodies were used to stain neurons, anti-MAP2 antibody (ab32454, 1:200) and corresponding Alexa594nm (ab150080, 1:400); astrocytes, anti-GFAP antibody (ab4674, 1:800); Alexa488nm (ab150169, 1:1000).
Statistical analysis
Statistical analysis of the results was performed using Sigma Plot 12.5 software. Data are presented as mean and standard error of the mean for visual convenience. The hypothesis of normal distribution was tested using the Shapiro-Wilk test. Two-sample Student's t-test and MannWhitney test were used for pairwise comparisons of groups. One-way analysis of variance (ANOVA) with post hoc comparison of groups using Dunn's and Bonferroni's methods was used to compare differences between groups and to determine statistical significance.
Results
Differences between 5xFAD hippocampal cultures and healthy native cultures
We found that astrocyte mitochondria in 5xFAD cultures are more prone to form fused mitochondrial networks (Figure 2A & B), whereas mitochondria in 5xFAD neurons conversely show a tendency to accumulate smaller mitochondria (Figure 2C & D). Primary hippocampal cultures from 5xFAD animals show marked astrogliosis—an overgrowth of the astrocytic network (68.6 ± 1.2 in 5xFAD, 52.3 ± 0.9 in native culture) with a concomitant decrease in neuronal density (37.3 ± 1.0 in 5xFAD, 47.4 ± 1.0 in native culture) as shown in Figure 2E-G. We also found that the intensity level of lipofuscin fluorescence (Figure 2H & I) was significantly higher in 5xFAD cultures than in healthy non-transgenic cultures (571 ± 3 in 5xFAD, 345 ± 3 in native culture).
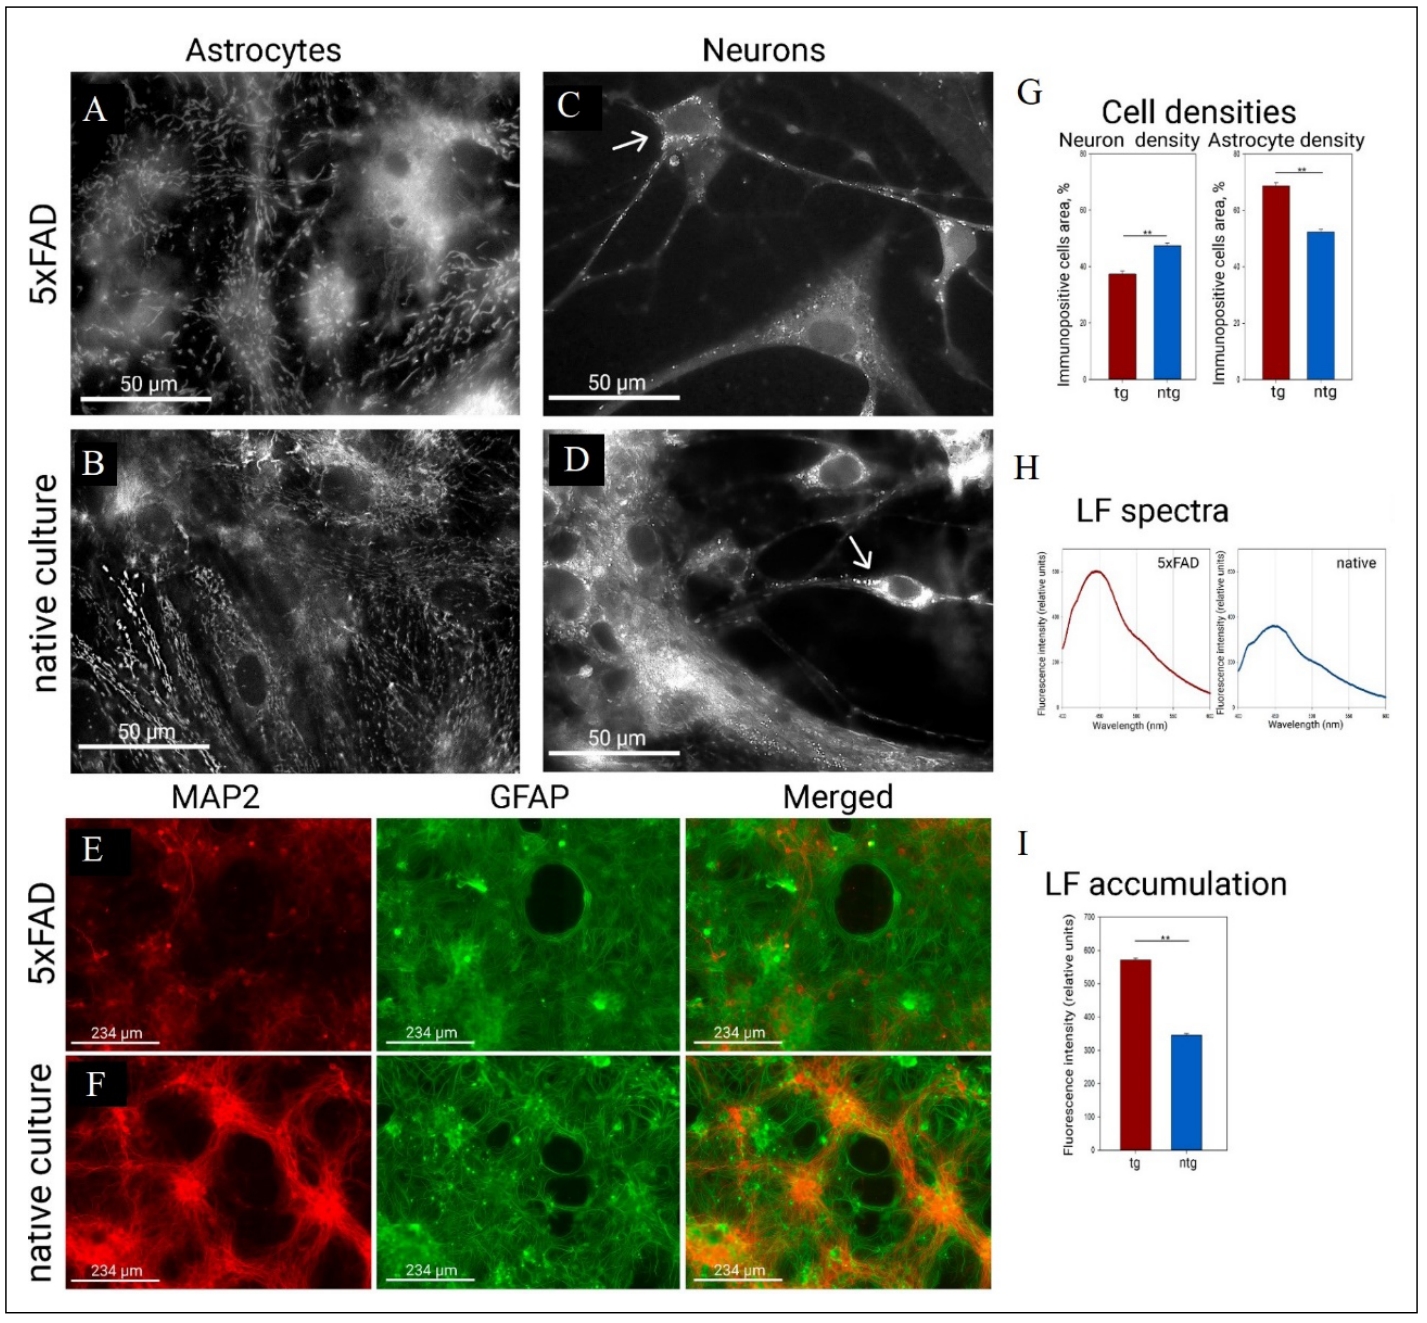
Figure 2. Mitochondrial morphology, cell morphology, and lipofuscin levels in control 5xFAD and native non-transgenic cell cultures. (А) Mitochondrial network with a tendency for mitochondrial fusion in 5xFAD astrocytes. (B) Mitochondrial network in healthy astrocytes, has more elongated mitochondria. (C) Mitochondria with a tendency to reduce their size in the neuron of cultures of 5xFAD mice (arrow indicates the body of the neuron). (D) Neurons in healthy cultures, you can see mitochondria of different sizes (arrow indicates the body of the neuron). Mitochondrial staining was performed by transfection/transduction with the CellLight BacMam 2.0 System. Mitochondrial morphology was examined on a Leica DM IL LED microscope using a ×100 oil-immersion objective. (E) Primary neuronal cultures of control transgenic 5xFAD culture that served as a reference for modeling pathogenesis, (F) Primary neuronal cultures of control healthy culture. Immunopositivity for an astrocyte marker (GFAP in green) and a neuronal marker (MAP2 in red). (G) Neuronal and astrocytic densities in 5xFAD hippocampal cultures and in healthy cultures. **P < 0.001, Student's t-test for astrocytic densities and Mann-Whitney test for neuronal densities. (H) Fluorescence emission spectra of lipofuscin fluorescence (360/450) in 5xFAD hippocampal cultures and in healthy cultures. (I) Fluorescence intensity at the maximum point (450). **P < 0.001, Mann-Whitney test.
Effects of MFP on primary neuronal culture
Utilization of the mitochondrial fusion promoter M1 (MFP) in astrocytes converts the mitochondrial network into a pool of fused and hyperfused mitochondria (Figure 3A). A similar pattern is observed in neurons, where fused mitochondria become like elongated sticks or large fused mitochondria (Figure 3B). Figure 3C-E shows a tendency for neuronal density to fall by day 1 of exposure and it falls significantly relative to the control native culture level by day 5 (47.4 ± 1 at native level, 36.7 ± 1.4 at day 5). There was a decrease in astrocytic density by day 1 (52.3 ± 1 in control, 48.6 ± 1.6 at day 1) and a further progresive decrease in density by day 5 (37.9 ± 1.5 at day 5). We also observe an interesting effect of decreasing lipofuscin fluorescence by day 1 (345 ± 2 in native levels, 277 ± 2 at day 1) and day 5 (131 ± 1.5) of fusion activator exposure in Figure 3F & G. Overall, prolonged exposure to MFP resembles a depletion of internal culture resources.
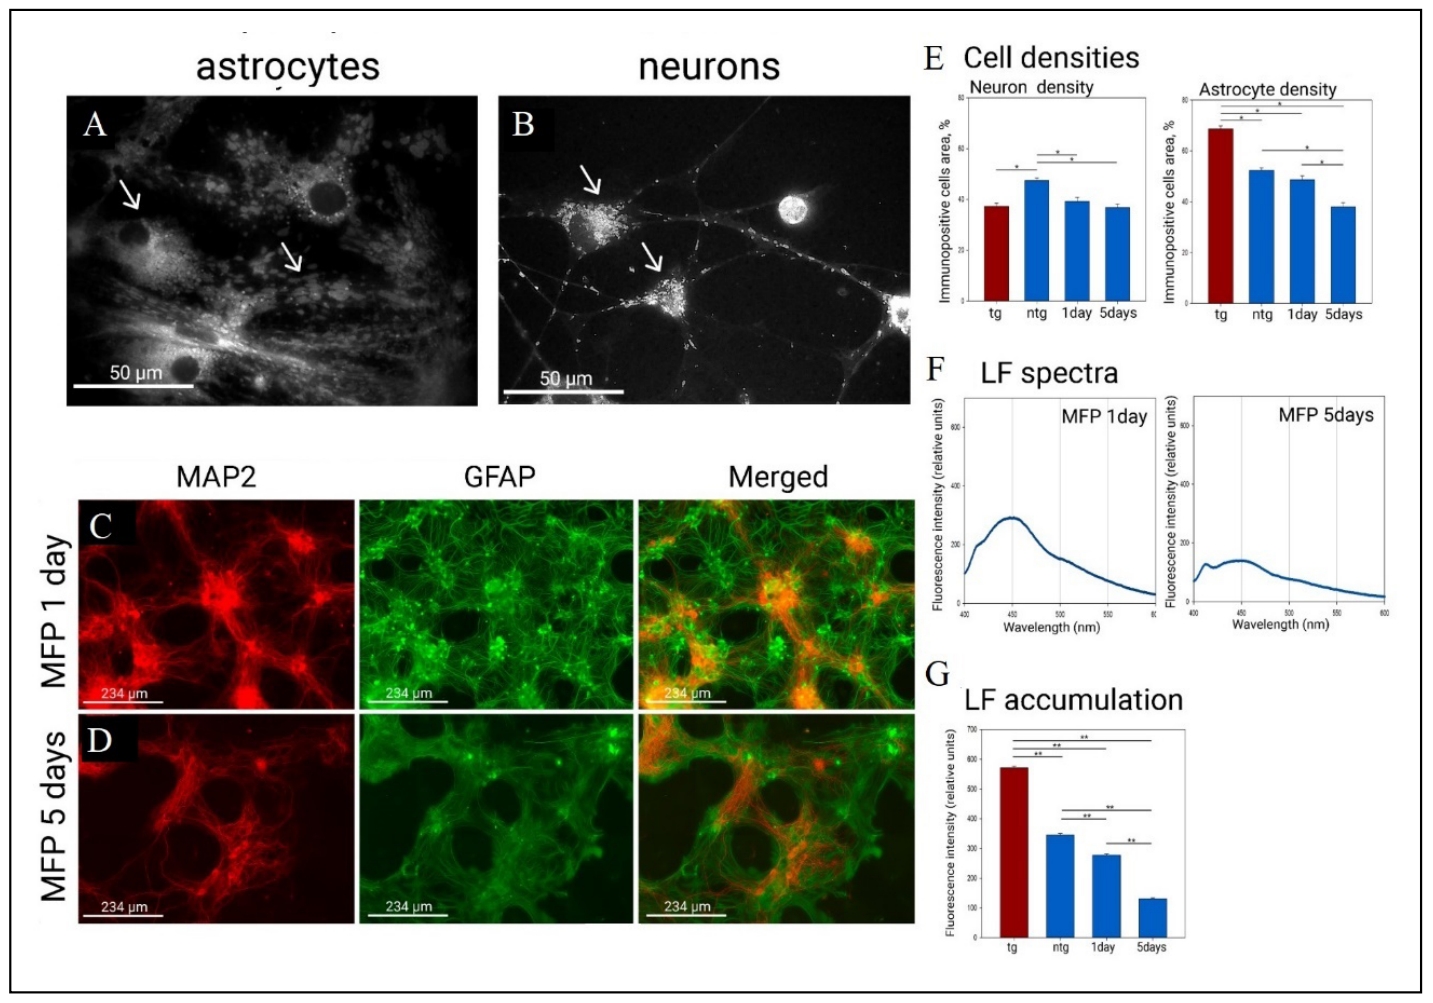
Figure 3. Mitochondrial morphology, cell morphology and lipofuscin levels in in the primary culture of the hippocampus under the action of mitochondrial fusion promoter M1 (MFP). (A) Mitochondria under the action of MFP in astrocytes fuse into grouped round (fused) or hyperfused mitochondria (bright examples are indicated by the arrow). (B) Mitochondria in neurons become larger under the action of MFP (arrow indicates neuron bodies). Mitochondrial staining was performed by transfection/transduction with the CellLight BacMam 2.0 System. Mitochondrial morphology was examined on a Leica DM IL LED microscope using a ×100 oil-immersion objective. (C) Effect of MFP on culture morphology after 1 day of administration. (D) Effect of MFP on culture morphology after 5 days of administration. Immunopositivity for an astrocyte marker (GFAP in green) and a neuronal marker (MAP2 in red). (E) Neuronal and astrocytic densities (in %) under the effect of MFP. *P < 0.05, one-way ANOVA followed by Dunn's post hoc test. (F) Fluorescence emission spectra of lipofuscin fluorescence (360/450) after 1 day and 5 days of MFP administration. (G) Fluorescence intensity at the maximum point (450). **P < 0.001, one-way ANOVA followed by Dunn's post hoc test.
Effects of mdivi-1 on primary neuronal culture
Morphologically, the use of the mitochondrial fission inhibitor mdivi-1 resulted in larger mitochondria being found in neuron bodies and neurites. At the same time, in astrocytes there was fragmentation of the mitochondrial network and instead fused mitochondria were found in greater numbers. We also observed a decrease in the pool of smallest mitochondria, which almost completely disappeared in astrocytes and remained only in neurons (Figure 4A & B). After one day of mitochondrial fission inhibition, neuronal density decreased relative to the control group (47.4 ± 1 at native level, 35 ± 2 at day 1) and did not decrease further by day 5. There was an increase in astrocytic density by day 1, and by day 5 (52.3 ± 1.2 at native level, 58.2 ± 1.7 at day 1, 68.1 ± 1.8 at day 5) as shown in Figure 4C-E. In addition, there was a significant increase in lipofuscin fluorescence correlating with the time of mdivi-1 exposure (Figure 4F & G). Moreover, by day 5 of mitochondrial fission inhibition, the intensity of lipofuscin fluorescence increased such that it was not significantly different from lipofuscin fluorescence in transgenic culture (571 ± 3 in Tg culture, 571 ± 2 at day 5). Thus, inhibition of mitochondrial fission in healthy cultures leads to a cascade of events reminiscent of those in transgenic culture.
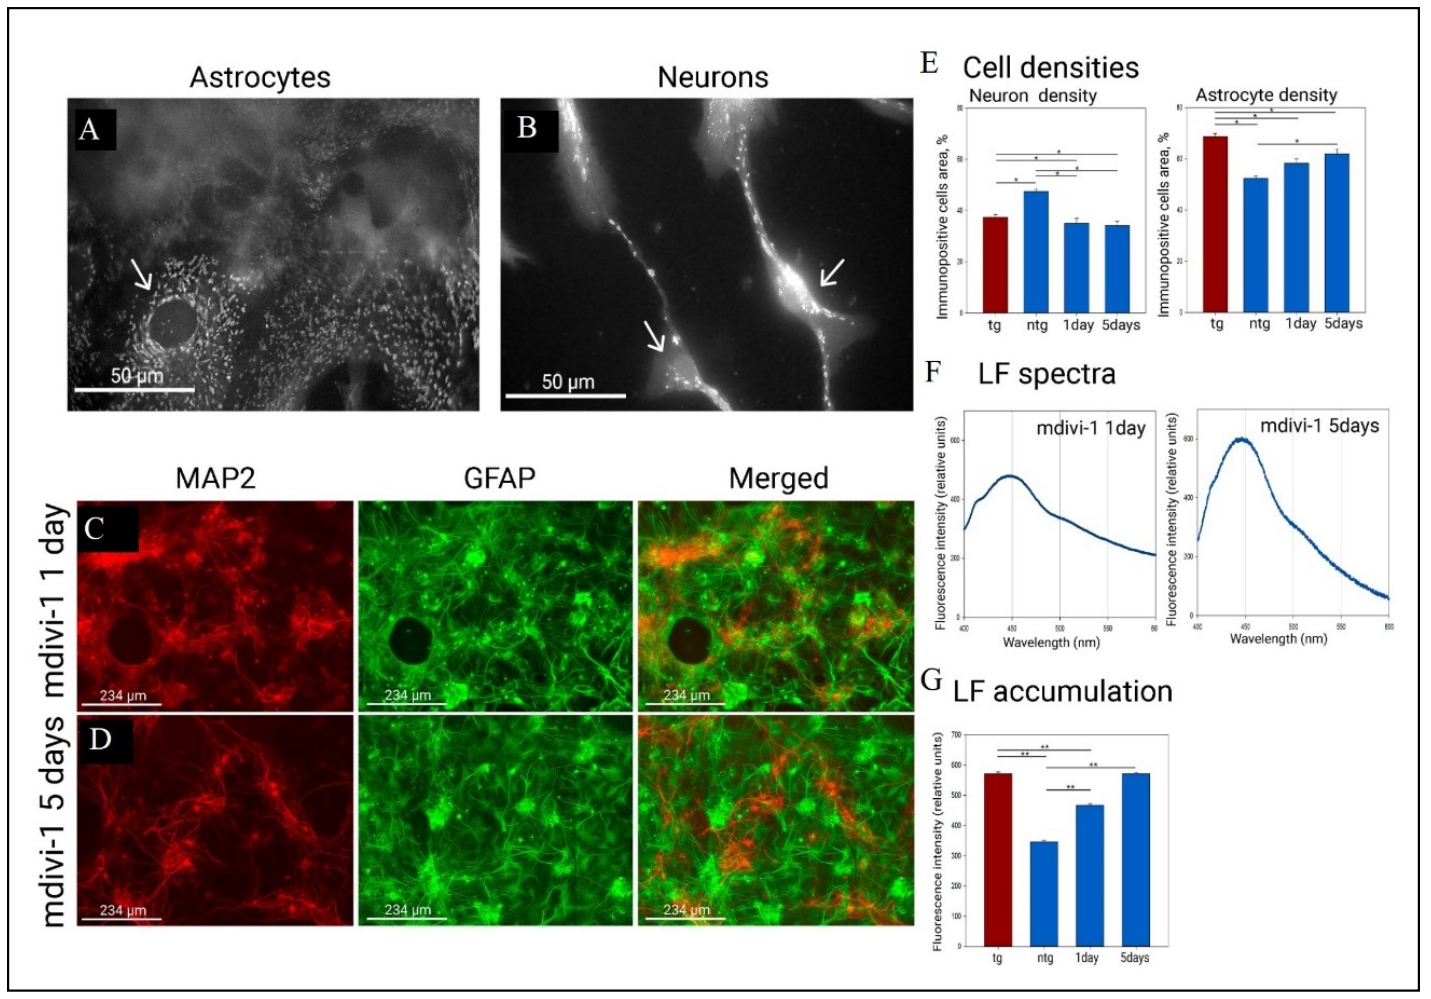
Figure 4. Mitochondrial morphology, cell morphology, and lipofuscin levels in in the primary culture of the hippocampus under the action of mitochondrial fission inhibitor (mdivi-1). (A) Mitochondria in astrocytes under the action of mdivi-1 lose the shape of the mitochondrial network, and the number of the smallest mitochondria also decreases. (B) Mitochondria in neurons under the influence of mdivi-1 become larger, the smallest mitochondria disappear (arrow indicates neuron bodies). Mitochondrial staining was performed by transfection/transduction with the CellLight BacMam 2.0 System. Mitochondrial morphology was examined on a Leica DM IL LED microscope using a ×100 oil-immersion objective. (C) Effect of mdivi-1 on culture morphology after 1 day of administration. (D) Effect of mdivi-1 on culture morphology after 5 days of administration. Immunopositivity for an astrocyte marker (GFAP in green) and a neuronal marker (MAP2 in red). (E) Neuronal and astrocytic densities (in %) under the effect of mdivi-1. *P < 0.05, one-way ANOVA followed by Dunn's post hoc test. (F) Fluorescence emission spectra of lipofuscin fluorescence (360/450) after 1 day and 5 days of mdivi-1 administration. (G) Fluorescence intensity at the maximum point (450). **P < 0.001, one-way ANOVA followed by Bonferroni post hoc test.
Effects of exogenous zinc on primary neuronal culture
We used exogenous zinc chloride solution to modulate mitochondrial fission. In this case, zinc overload at high, rather uncomfortable concentrations for nerve cells, induces cellular and mitochondrial stress affecting mitochondrial morphology, which is consistent with the results of [17]. Primary cultured neurons are the first to suffer from zinc overload at the same time in culture it was observed compensatory astrogliosis (Figure 5C). Treatment of cultures with excessive zinc resulted in neurite destruction and a drop in neuronal density relative to control cultures (47.4 ± 1 in native, 29 ± 1.5 under toxic influence), while there was a strong compensatory astrocyte overgrowth (52.38 ± 1 in native, 62.7 ± 2.2 under toxic influence) and an increase in lipofuscin fluorescence intensity (Figure 5H) (344.9 ± 2.7 in native, 440 ± 1.2 under toxic influence). Using lower concentrations of zinc chloride solution allowed us to achieve the same morphologically detectable mitochondrial fission (Figure 5A & B) in which neurites do not receive such high zinc overload (Figure 5D-F). Low zinc concentrations caused no significant change in neuronal and astrocytic density by day 1, but reduced lipofuscin fluorescence intensity (265 ± 1 at day 1). However, on day 5 (Figure 5F) of the experiment, a fall in neuronal density was already again observed (47.4 ± 1 at native, 27.7 ± 1.3 at day 5) with a concomitant drop in astrocyte density (52.3 ± 1 at native, 35.4 ± 1.8 at day 5), and the cluster morphology of the culture was impaired, neurons became less likely to assemble into clustered structures, and began to show altered immunoreactivity for glial fibrillary acidic protein, and pathologic aggregation of GFAP increased, but lipofuscin fluorescence intensity was still reduced (190 ± 3 at day 5) as shown in Figure 5G & H.
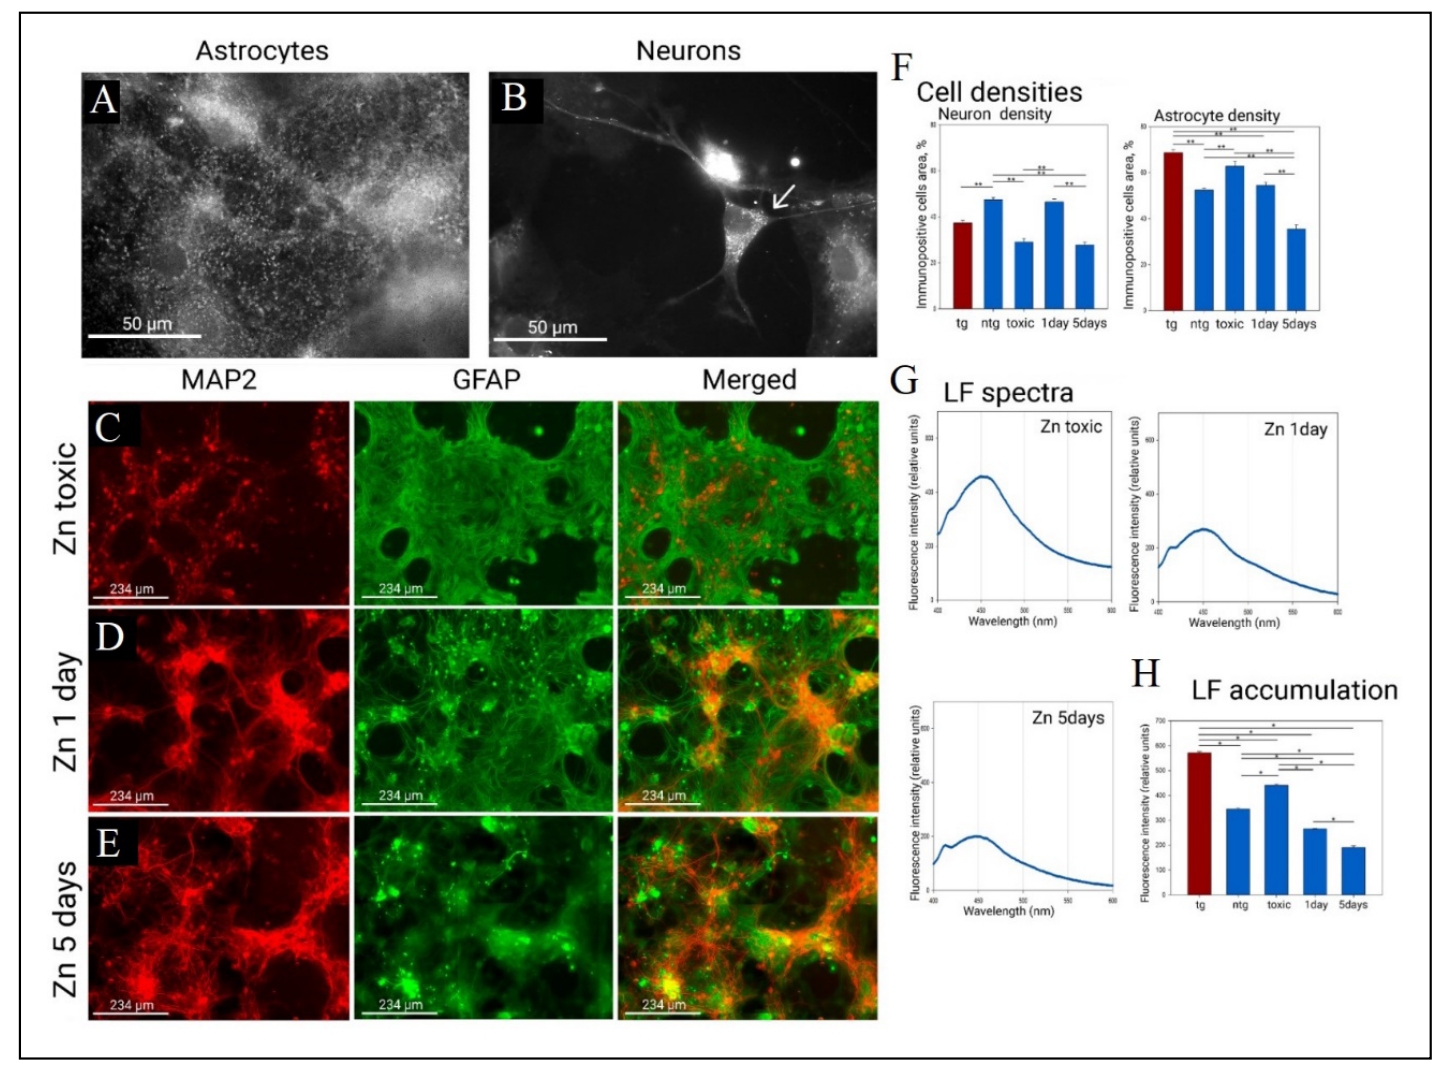
Figure 5. Mitochondrial morphology, cell morphology and lipofuscin levels in in the primary culture of the hippocampus under the action of Zn. (A) Mitochondria in astrocytes under the action of zinc completely lose the shape of the network. (B) Mitochondria in neurons under the action of zinc become small (arrow indicates neuron bodies). Mitochondrial staining was performed by transfection/transduction with the CellLight BacMam 2.0 System. Mitochondrial morphology was examined on a Leica DM IL LED microscope using a ×100 oil-immersion objective. (C) Effect of toxic zinc concentrations on culture morphology. (D) Effect of zinc on culture morphology after 1 day of administration. (E) Effect of zinc on culture morphology after 5 days of administration. Immunopositivity for an astrocyte marker (GFAP in green) and a neuronal marker (MAP2 in red). (F) Neuronal and astrocytic densities (in %) under the effect of zinc. **P < 0.001, one-way ANOVA followed by Dunn's post hoc test. (G) Fluorescence emission spectra of lipofuscin fluorescence (360/450) after 1 day and 5 days of zinc administration. (H) Fluorescence intensity at the maximum point (450). *P < 0.05, one-way ANOVA followed by Dunn's post hoc test.
Discussion
Normal mitochondrial fusion and fission dynamics are the basis for maintaining a healthy mitochondrial pool also through
mitophagy, the disruption of which leads to the degradation of mitochondria into lipofuscin granules
[18]. First, we would like to talk about lipofuscin. We see that the accumulation of
lipofuscin in our experiments occurs in two cases. The first is the toxic effect of high concentrations of exogenous zinc, which
is well explained by the activation of peroxidation and, in general, a quite common pathway of lipofuscin increase. The second is
the inhibition of mitochondrial fission. Thus, by day 5 of fission inhibition, the fluorescence intensity of lipofuscin in the
experimental groups is compared to control 5xFAD transgenic animals. According to [19],
the normal mitochondrial fission cycle involves the formation of two daughter mitochondria, one of which has a higher membrane
potential and goes on to the fusion-fission cycle, and the other, with a more depolarized membrane, remains separated until
the membrane potential is restored or until elimination by autophagy. We can assume that the increase in lipofuscin in this case
is a process of accumulation of intracellular debris associated with insufficient mitochondrial division and clearance. Therefore,
activation of fission by non-toxic concentrations of zinc, although leading to deleterious effects in culture, decreased the level
of lipofuscin. At the same time, activation of mitochondrial fusion, although leading to the degradation of the culture, did not
lead to the formation of lipofuscin. On the contrary, it decreased over time. This can be taken to mean that by acting on the
fusion promoter, we are not blocking fission, and mitochondria can still maintain fission dynamics. Also, given the close
relationship between lipofuscin and peroxidation, we can assume that when mitochondria fuse, cells are not subjected to oxidative
stress.
It has been reported that 5xFAD transgenic mice and a reproducible neuro-astrocytic culture from them, which we used as a control,
already have a shift in the mitochondrial balance toward excessive fission [20]. Loss of
the central mitochondrial fission protein dynamin-related mitochondrial fission protein 1 (Drp1) also increases the toxicity of
mutant APP in vivo [21]. In the 5xFAD mouse model, all mutations target the
hyperproduction of human Aβ1-42 [22]; it is the overproduction of toxic agents that
causes the dysfunction in this model. We assume that the increased mitochondrial fission in this model is secondary and related to
the fact that the cells are trying to get rid of toxic amyloid in this way. In our experiments, inhibition of mitochondrial fission
resulted in a cascade of reactions characteristic of the 5xFAD culture. In addition to a pathologic increase in lipofuscin, we
observed a decrease in neuronal density and a compensatory overgrowth of astroglia, which can be considered a manifestation of
astrogliosis in this model. That is, cellular toxin accumulation and mitochondrial fission mediate each other. At the same
time activation of cell division did not lead to such consequences. However, we can assume that zinc is a toxic agent in general
and its mechanism of operation is a reflection of how the introduction of an external toxic agent leads to an attempt of
mitochondria to clean themselves and the cell of contaminants. In doing so, the prolonged action of the fusion promoter
resembles the depletion of internal resources in a healthy culture. This process of slow degeneration is broadly similar to one
pathway of cell culture degeneration. It loses clustering and shrinks (although there is generally another pathway of culture
degradation, abrupt neurosphere clustering, in which thin neuro-astrocytic strands stretch between densely packed neurospheres,
linking them to other neurospheres; this is characteristic of primary cultures with high initial stem cell content or their
increased level of activity). Mitochondrial fusion is thought to result in enhanced ATP energy supply to the cells, as they have
more cristae, increased levels of dimerization and ATP synthase activity, and support ATP synthesis
[23, 24]. However, excess ATP leads to neuronal
dysfunction and death [25] and is a prerequisite for the realization of the cellular
apoptosis cascade [26]. In this case, the mitochondria resulting from fusion may be too
large for mitochondrial transport. We find it difficult to say what the mechanism of culture degeneration is in this case. However,
the absence of oxidative stress and the drop in lipofuscin levels shows that this process is more likely a controlled extinction
of activity rather than an abrupt pathology. It can be stated unequivocally that only harmonious functioning of this system can
ensure normal physiological functions of mitochondria, and any shift to one side of the dynamic process leads to disorders.
Conclusions
Forced alteration of mitochondrial fusion and fission leads to morphologic changes in primary neuro-astrocytic cultures of mouse hippocampus. Activation of mitochondrial fusion leads to slow depletion of the culture in the absence of visible degenerative processes and oxidative stress. Inhibition of mitochondrial fission leads to a cascade of events reminiscent of those occurring in a culture of 5xFAD animals (a genetic model of AD)—astrogliosis, decreased neuronal density, and increased lipofuscin levels. Exogenous zinc induces mitochondrial fission and provokes compensatory astrogliosis at toxic concentrations, and at lower concentrations leads to a slow decrease in culture clustering, and changes in astrocyte immunoreactivity to GFAP and its aggregation, whereas lipofuscin fluorescence was still decreased. We suggest that mitochondrial fission in models of toxic mitochondrial damage is a compensatory process in which mitochondria strive to clear the cell of toxic agents, but which may lead to a cascade of reactions that provoke further development of pathologies.
Declarations
Acknowledgments
The authors extend their appreciation to V.I. Kovalev for constructive feedback during the preparation of the manuscript.
Authors' contributions
The authors contributed equally to the preparation of the study.
Availability of data and materials
Results of the work can be found at the google link or write to the corresponding author.
Conflicts of interest
All authors declared that there are no conflicts of interest.
Financial support and sponsorship
This work was supported by the Russian Science Foundation (RSF), project No. 23-25-00485.
Ethical approval and consent to participate
The laboratory animals were treated in accordance with the European Convention for the Protection of Vertebrates used for experimental and other purposes (Strasbourg, 1986) and the principles of the Helsinki Declaration (2000). All animal procedures performed with mice were approved by the Commission on Biosafety and Bioethics (Institute of Cell Biophysics—Pushchino Scientific Center for Biological Research of the Russian Academy of Sciences) in accordance with Directive 2010/63/EU of the European Parliament.
References
1. Wang W, Zhao F, Ma X, Perry G, & Zhu X. Mitochondria dysfunction in the pathogenesis of Alzheimer's disease: recent advances. Mol Neurodegener, 2020, 15(1): 30-40. [Crossref]
2. Peng Y, Gao P, Shi L, Chen L, Liu J, & Long J. Central and peripheral metabolic defects contribute to the pathogenesis of Alzheimer's disease: targeting mitochondria for diagnosis and prevention. Antioxid Redox Signal, 2020, 32(16): 1188-1236. [Crossref]
3. Sorrentino V, Romani M, Mouchiroud L, Beck JS, Zhang H, D'Amico D, et al. Enhancing mitochondrial proteostasis reduces amyloid-β proteotoxicity. Nature, 2017, 552(7684): 187-193. [Crossref]
4. Wang X, Wang W, Li L, Perry G, Lee H-g, & Zhu X. Oxidative stress and mitochondrial dysfunction in Alzheimer's disease. Biochimica et Biophysica Acta (BBA)-Molecular Basis of Disease, 2014, 1842(8): 1240-1247. [Crossref]
5. Archer SL. Mitochondrial dynamics—mitochondrial fission and fusion in human diseases. N Engl J Med, 2013, 369(23): 2236-2251. [Crossref]
6. Kikugawa K, Kato T, Beppu M, & Hayasaka A. Fluorescent and cross-linked proteins formed by free radical and aldehyde species generated during lipid oxidation. Adv Exp Med Biol, 1989, 266: 345-357. [Crossref]
7. Dehkordi SK, Walker J, Sah E, Bennett E, Atrian F, Frost B, et al. Profiling senescent cells in human brains reveals neurons with CDKN2D/p19 and tau neuropathology. Nat Aging, 2021, 1(12): 1107-1116. [Crossref]
8. Moreno-García A, Kun A, Calero O, Medina M, & Calero M. An overview of the role of lipofuscin in age-related neurodegeneration. Front Neurosci, 2018, 12: 464-474. [Crossref]
9. Serwer P, Wright ET, & Hunter B. Additions to alphasheet based hypotheses for the cause of Alzheimer's disease. J Alzheimers Dis, 2022, 88(2): 429-438. [Crossref]
10. Stefanova NA, Kozhevnikova OS, Vitovtov AO, Maksimova KY, Logvinov SV, Rudnitskaya EA, et al. Senescenceaccelerated OXYS rats: a model of age-related cognitive decline with relevance to abnormalities in Alzheimer disease. Cell Cycle, 2014, 13(6): 898-909. [Crossref]
11. Avetisyan AV, Samokhin AN, Alexandrova IY, Zinovkin RA, Simonyan RA, & Bobkova NV. Mitochondrial dysfunction in neocortex and hippocampus of olfactory bulbectomized mice, a model of Alzheimer's disease. Biochemistry, 2016, 81(6): 615-623. [Crossref]
12. Calkins MJ, Manczak M, Mao P, Shirendeb U, & Reddy PH. Impaired mitochondrial biogenesis, defective axonal transport of mitochondria, abnormal mitochondrial dynamics and synaptic degeneration in a mouse model of Alzheimer's disease. Hum Mol Genet, 2011, 20(23): 4515-4529. [Crossref]
13. Zhang L, Trushin S, Christensen TA, Tripathi U, Hong C, Geroux RE, et al. Differential effect of amyloid beta peptides on mitochondrial axonal trafficking depends on their state of aggregation and binding to the plasma membrane. Neurobiol Dis, 2018, 114: 1-16. [Crossref]
14. Bilkei-Gorzo A. Genetic mouse models of brain ageing and Alzheimer's disease. Pharmacol Ther, 2014, 142(2): 244-257. [Crossref]
15. Chaplygina AV, Kovalev VI, & Zhdanova DY. The study of lipofuscin levels in the 5xFAD mouse model of Alzheimer's disease. Adv Gerontol, 2023, 36(5): 720-728.
16. Chaplygina AV, & Vekshin NL. Lipofuscin and mitolipofuscin in organs of young and adult rats. Adv Gerontol, 2018, 31(2): 197-202. [Crossref]
17. Knies KA, & Li YV. Zinc cytotoxicity induces mitochondrial morphology changes in hela cell line. Int J Physiol Pathophysiol Pharmacol, 2021, 13(2): 43-51.
18. Rodolfo C, Campello S, & Cecconi F. Mitophagy in neurodegenerative diseases. Neurochemistry international, 2018, 117: 156-166. [Crossref]
19. Liesa M, & Shirihai OS. Mitochondrial dynamics in the regulation of nutrient utilization and energy expenditure. Cell Metab, 2013, 17(4): 491-506. [Crossref]
20. Wang L, Guo L, Lu L, Sun H, Shao M, Beck SJ, et al. Synaptosomal mitochondrial dysfunction in 5xFAD mouse model of Alzheimer's disease. PLoS One, 2016, 11(3): e0150441. [Crossref]
21. Shields LY, Li H, Nguyen K, Kim H, Doric Z, Garcia JH, et al. Mitochondrial fission is a critical modulator of mutant APP-induced neural toxicity. J Biol Chem, 2021, 296: 100469. [Crossref]
22. Ismeurt C, Giannoni P, & Claeysen S. The 5ŨFAD mouse model of Alzheimer's disease. In: Diagnosis and Management in Dementia. edn.: Elsevier; 2020: 207-221.
23. Hoitzing H, Johnston IG, & Jones NS. What is the function of mitochondrial networks? A theoretical assessment of hypotheses and proposal for future research. Bioessays, 2015, 37(6): 687-700. [Crossref]
24. Gomes LC, Di Benedetto G, & Scorrano L. During autophagy mitochondria elongate, are spared from degradation and sustain cell viability. Nat Cell Biol, 2011, 13(5): 589- 598. [Crossref]
25. Pontes MH, Sevostyanova A, & Groisman EA. When too much ATP is bad for protein synthesis. J Mol Biol, 2015, 427(16): 2586-2594. [Crossref]
26. Zamaraeva MV, Sabirov RZ, Maeno E, Ando-Akatsuka Y, Bessonova SV, & Okada Y. Cells die with increased cytosolic ATP during apoptosis: a bioluminescence study with intracellular luciferase. Cell Death Differ, 2005, 12(11): 1390-1397. [Crossref]